As the US stock markets have risen since March 2009 so has the total balance sheet of the Federal Reserve (Fed)--the Central Bank of the United States of America--through a myriad of economic stimulus programs. From around $925B in early September 2008 to now $6.7T early May 2020. You can find the Fed’s Balance Sheet (FBS) trend on a weekly interval here. I am not going to detail all these programs, what they entail and exactly do. You can find all about it on the Fed’s website here.
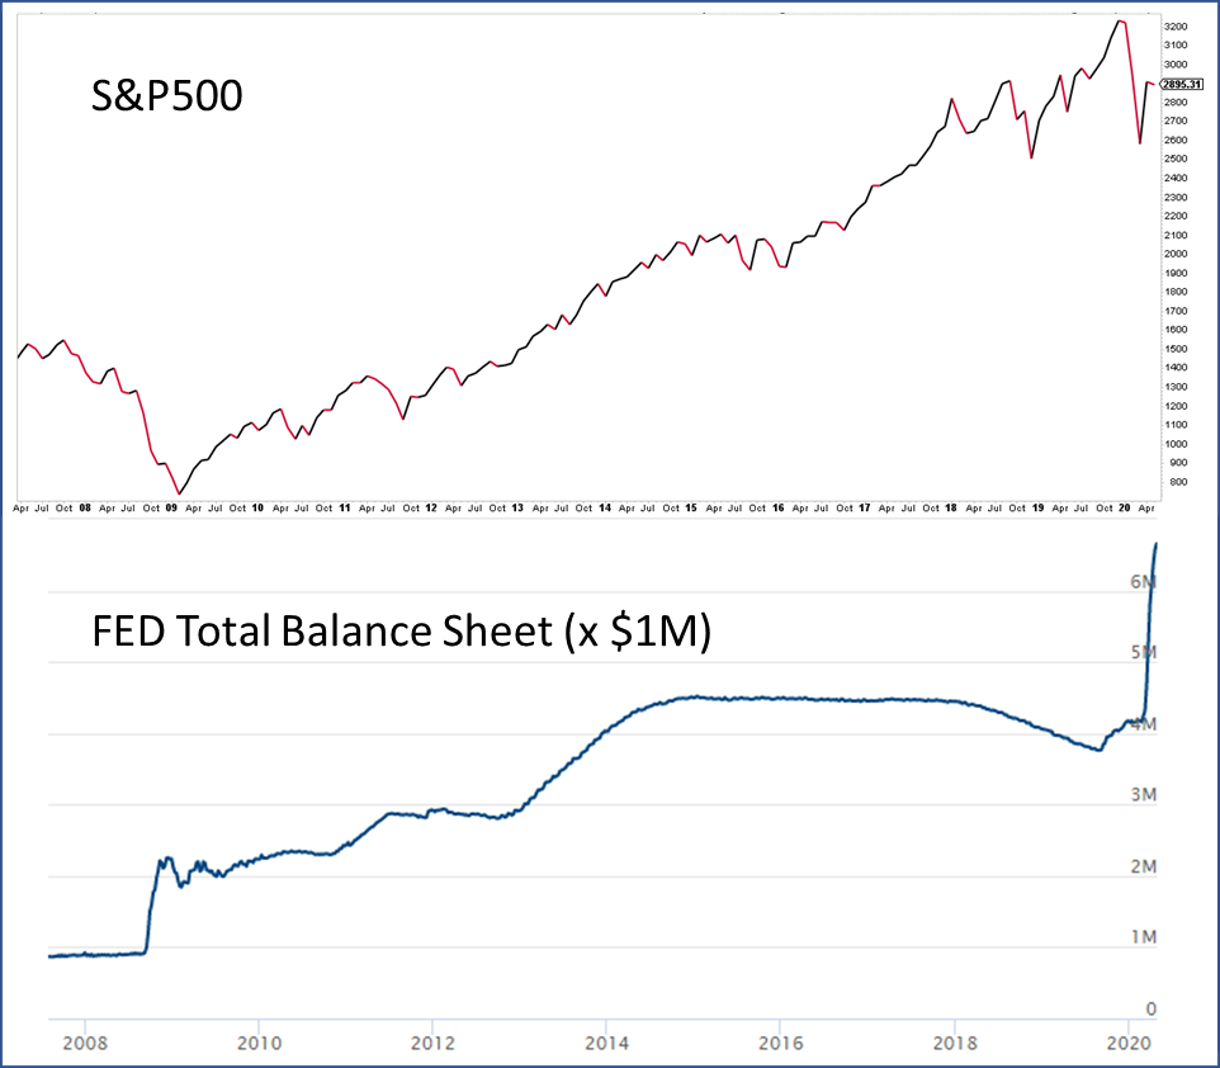
It is commonly believed these programs provided extra liquidity to the stock markets causing them to rise, and since the Fed has in theory infinitely deep pockets it is therefore said to “not fight the Fed”. The argument is then substantiated by overlaying the chart of say the S&P 500 with the Fed’s balance sheet trend. At first glance we can see both are moving higher. Voilà! Case closed. See Figure 1 below.
Figure 1. S&P 500 April 2007 - To Date, and the Fed’s Total Balance Sheet August 2007 - To Date

But…, not so fast. The devil is always in the details. There are of course many more factors that affect the direction of the financial markets, e.g. earnings, stock buy backs, geopolitics, economics, etc. Since I am a scientist by training, I want to put the “do not fight the Fed” mantra through some rigorous hypothesis testing before I believe it.
- My null hypothesis is “there is no relationship between the FBS and the S&P 500 (SPX)”.
- My alternative hypothesis is “there is a relationship between the FBS and the S&P 500 (SPX)”
The FBS started increasing the week ending September 17, 2008. Since then there are 608 weekly data points. A great data set to do statistics on. The FBS can each week increase (+) or decrease (-), and the SPX can go of course also go up (+) or down (-) for each week. Thus, there are four possible scenarios: FBS+ SPX+; FBS- SPX-; FBS+ SPX-, FBS- SPX-. The first two mean the FBS and SPX move in the same direction, while the latter two mean the FBS and SPX move in opposite directions. If there is no relationship between the FBS and SPX then each category would be randomly distributed, i.e. have a roughly 25% chance of happening (25% of 608 weeks is 152 weeks). If there is a relationship, then say the category when both the FBS and SPX increase during any given week should be greater than 152.
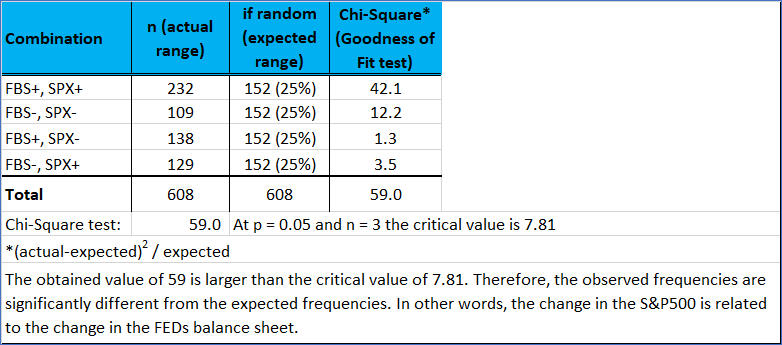
What I find is that out of these 608 weeks the FBS and SPX both increased for 232 weeks, both decreased over 109 weeks, and moved in opposite direction of each other for 267 weeks. Thus, since September 17, 2008 until now the FBS and S&P 500 moved in the same direction only 56% of the time: 608 / (232+109). That is technically and surprisingly close to flipping a coin (50% chance of heads or tail).
Is 56% enough to be statistically significant? I used a Chi-Square Goodness of Fit test to determine if the observed number of weeks for each scenario is significantly different from the expected (randomness = 25% of 608 = 152) number of weeks. See the table below.
Table 1. Frequency distribution and Statistical Test Outcome

The test tells us the weekly change in the S&P 500 is statistically significant related to the weekly change in the Fed’s total balance sheet, even though both only move 56% of the time in the same direction, which in turn tells us there are indeed many other factors at play influencing the market’s direction.
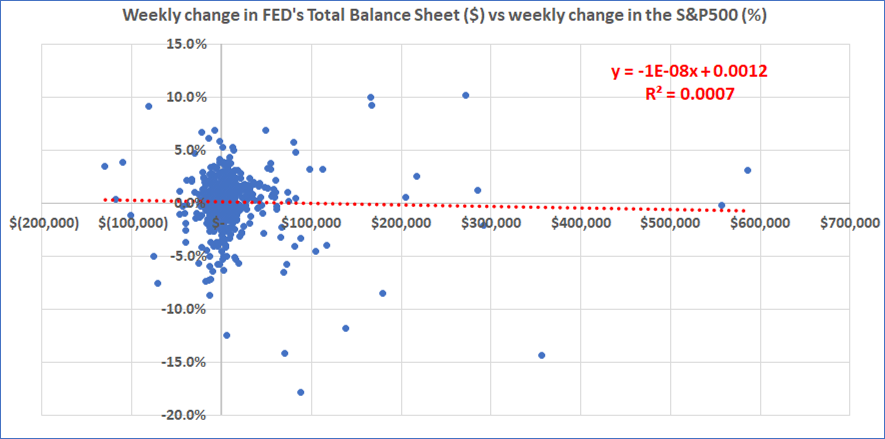
I also checked if the weekly change in the balance sheet maybe plays a role in the magnitude change in the SPX; both either as a percentage (%) or dollar amount ($), e.g.one would expect the larger the FBS’ weekly increase the more the SPX gains. When I plot both I find however no relationship. In this case size does not matter as they say.
Figure 1. Weekly change in Fed's Total Balance Sheet ($) vs weekly change in the S&P 500 (%)

Bottom line: Don’t fight the Fed is correct because although since September 2018 until now the Fed’s balance sheet and the S&P 500 have moved in the same direction only 56% of the time, it is statistically significant. However, the change in the weekly Fed total balance sheet has had no effect on the weekly change of the S&P 500. Thus, rest assured, there were still many other factors than the Fed impacting the financial markets.
