OPEC will no doubt be finally drawing a collective sigh of relief as the management of the glut of oil supply finally seems to be coming under control, as prices hit their highest level since July 2015, with the consensus view that the oil market is finally rebalancing itself with a potential return to a more regulated and controlled market for its members. So far this year, OPEC and its members, along with non-OPEC members such as Russia, have cut production by around 1.8 million barrels per day since early 2017. This has finally helped to lift oil prices by around 15% in the last quarter.
The Kuwaiti Oil Minister, Essam al-Marzouq, who chaired the recent meeting in Vienna, confirmed OPEC’s view that the current targets were helping to cut output to the five year average objective. However, whilst Russia has upheld its own agreed targets, it has yet to confirm whether these will continue beyond the end of March 2018, thereby raising concerns for oil prices in 2018.
Meanwhile Nigeria and the UAE continue to operate at or below the currently agreed supply targets, and with Turkey threatening to cut off a key supply line from Northern Iraq, this too has helped to drive oil prices higher. Indeed should the Turkish threat be carried out, this could cut over 500,000 barrels of oil a day from the supply chain, helping to boost prices further.
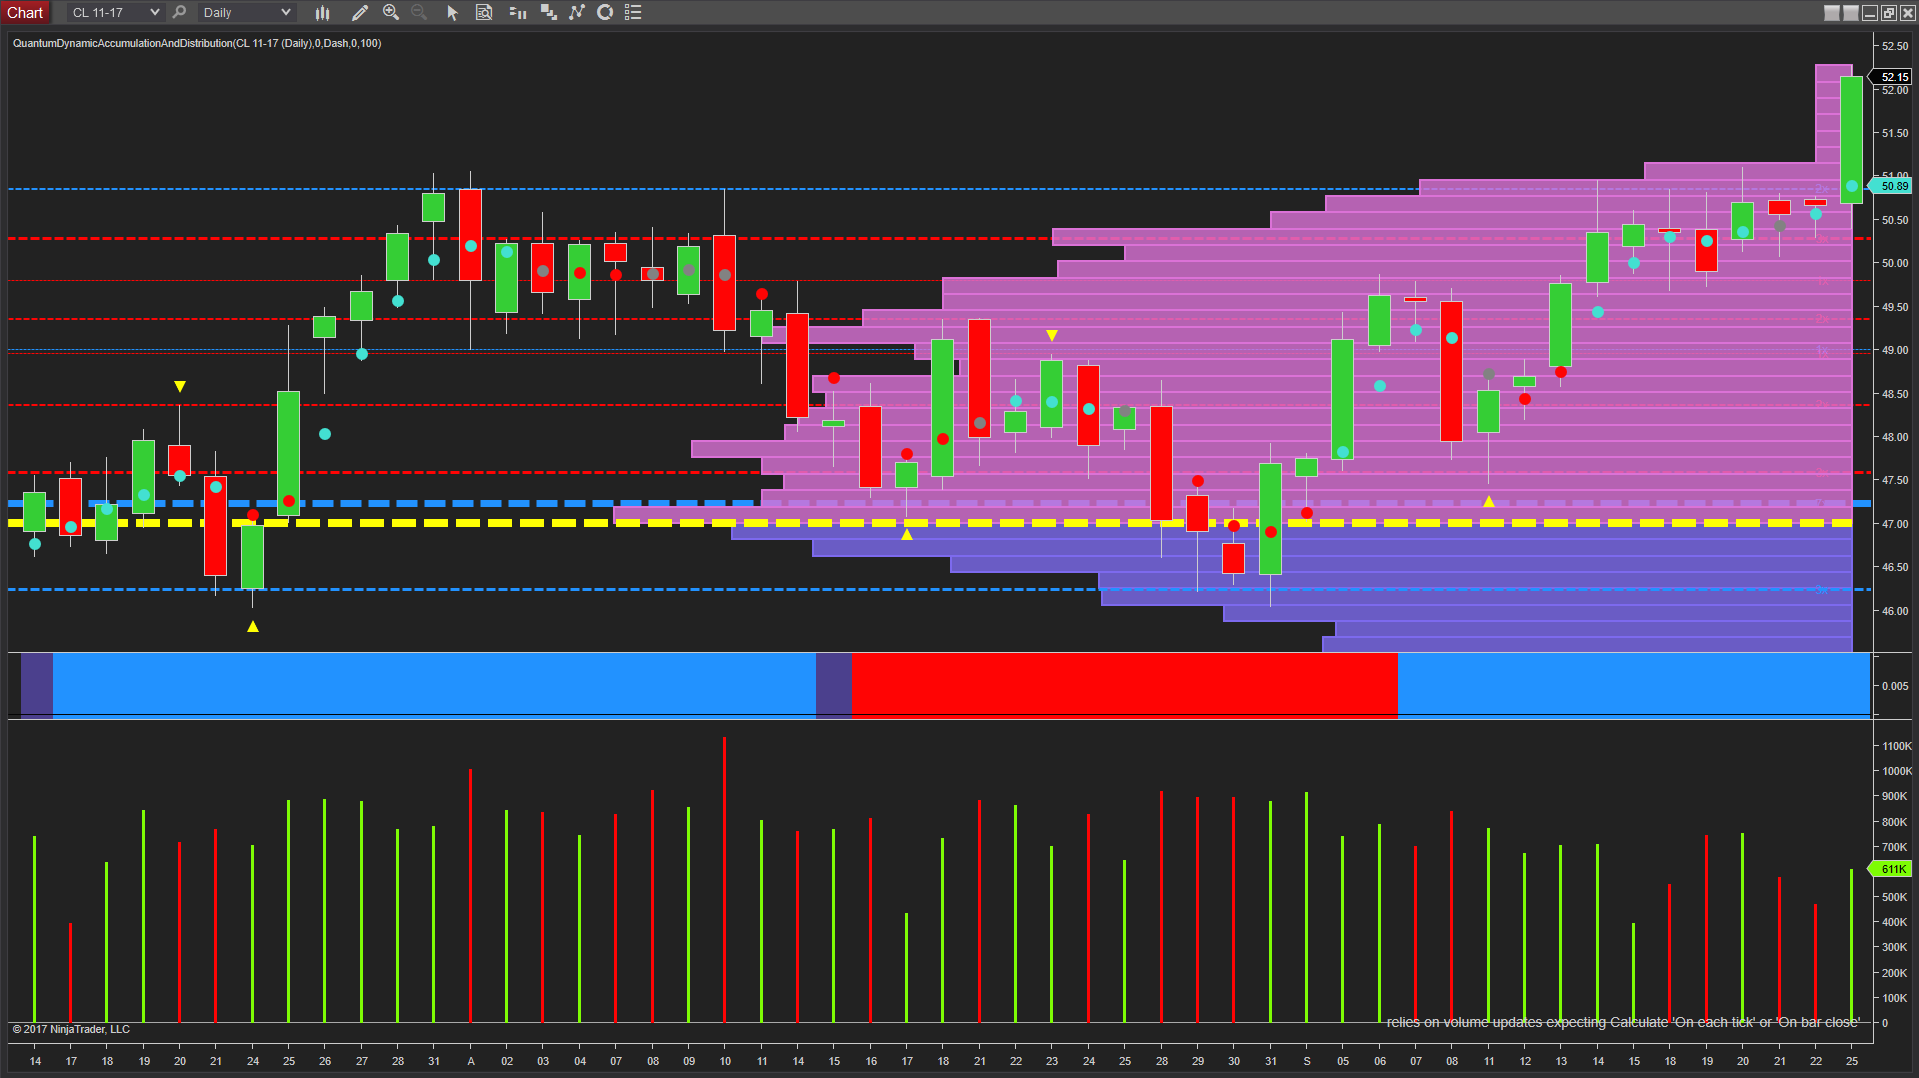
From a technical perspective, yesterday was pivotal for WTI futures, with the price breaking through the key resistance level at $50.90 per barrel. This is a region which has been tested several times in the last few weeks, repeating the price action of mid August which saw this level hold, with oil prices duly reversing.
This time however, the market appears to have breached this level with confidence. Supported by solid volume yesterday, the candle closed the session as a wide-spread up with no wicks, confirming that bullish sentiment is now in place.
Plus, with little in the way of meaningful resistance ahead, we could see a test of the $55.55 per barrel high of mid April. It is also interesting to note that the correlation between oil and the US dollar appears to have broken down for the time being, with oil rising along with the US dollar which has discovered some minor bullish momentum.
This general disconnect has been evident for some time, confirming that the price of oil is governed more by management of the supply than a market of true price discovery. Whilst this is always the case when OPEC is involved, this factor is particularly strong at present, and no doubt once the over-supply situation is brought back into balance, this relationship will reconnect once again.
Whilst it was certainly a red letter day for oil prices, the same could also be said for the alternative energy suppliers who will be cheered by falling production costs and rising profits, unlike OPEC members and non members whose production costs are likely to remain high for the foreseeable future.
