Get 40% Off
👀 👁 🧿 All eyes on Biogen, up +4,56% after posting earnings. Our AI picked it in March 2024.
Which stocks will surge next?
Unlock AI-picked Stocks

A Month Ahead: USD/CAD's Bullish Reversal

Published 02/10/2019, 05:56 AM
Updated 07/09/2023, 06:31 AM

USD/CAD finished 2018 in a positive mood. The pair reached 1.3665 on the last day of last year, but 2019 has not been so generous to the bulls so far. By February 1st, the rate was down to 1.3069, losing over 4.3% in just a month.

But let’s take a step back and see where exactly was USD/CAD trading at in mid-January. It shows that the U.S. dollar has been following its Elliott Wave path against the Canadian dollar for almost a month now.
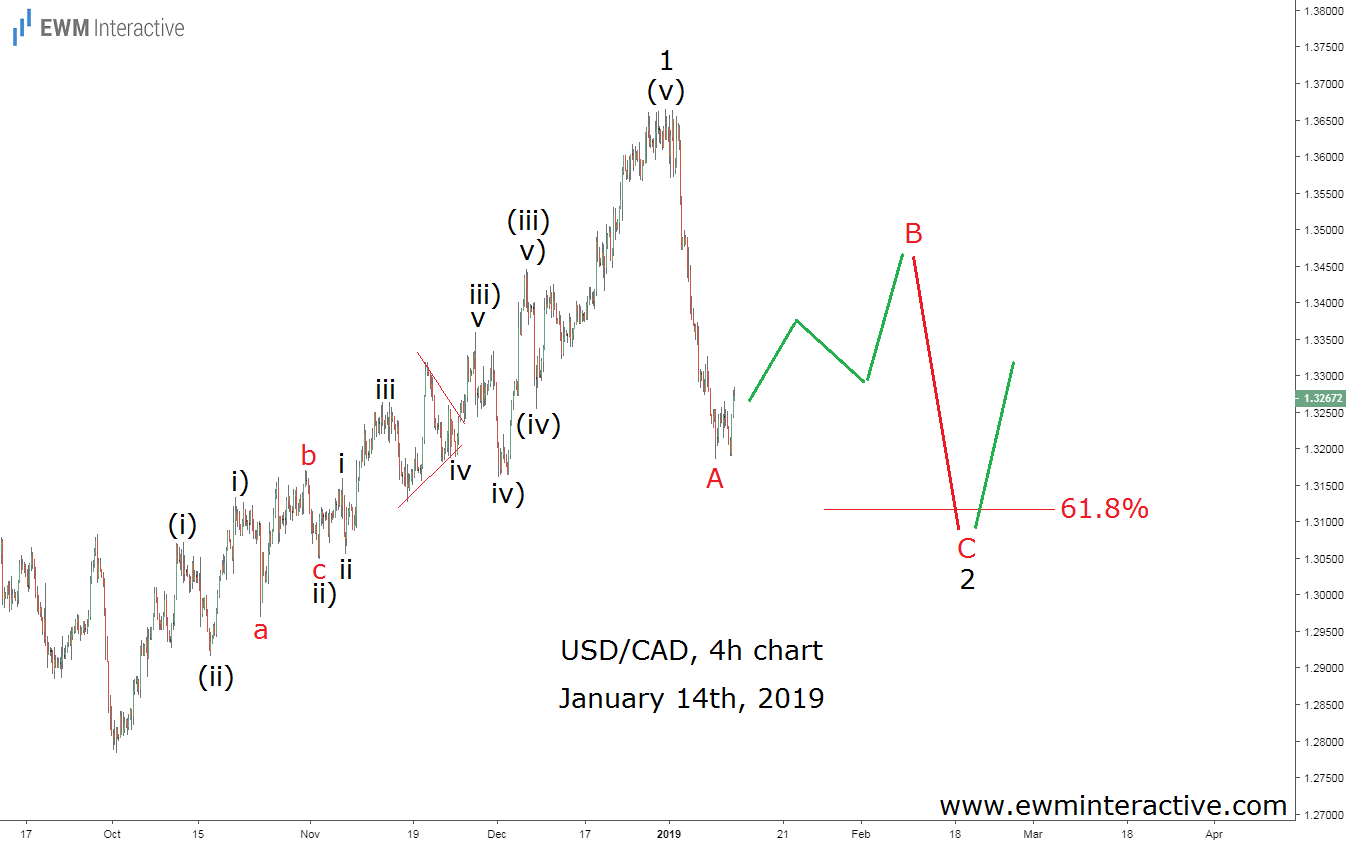
USDCAD 4 Hour Chart January 14th 2019

The 4-hour chart allowed us to see the wave structure of USD/CAD’s rally from 1.2783. We admit it wasn’t exactly a textbook impulse pattern, but there was a way to count it as a five-wave sequence without breaking any rules. According to the bigger time-frames, also included in our analyses, that was the right approach.

This, in turn, meant that the sharp selloff from 1.3665 must be the first phase – wave A – of a larger three-wave A-B-C correction in wave 2. The 61.8% Fibonacci level looked like a reasonable bearish target in wave C. But first, it was time for a short-term recovery in wave B.

USD/CAD Bulls Had To Return Near 1.3100

Once the entire three-wave retracement in wave 2 was over, it made sense to prepare for a bullish reversal from the above-mentioned Fibonacci level. That was all the information we could extract from USD/CAD’s 4-hour chart on January 14th. Almost a month later, the updated chart below shows how the situation has been developing.
3rd party Ad. Not an offer or recommendation by Investing.com. See disclosure here or remove ads .

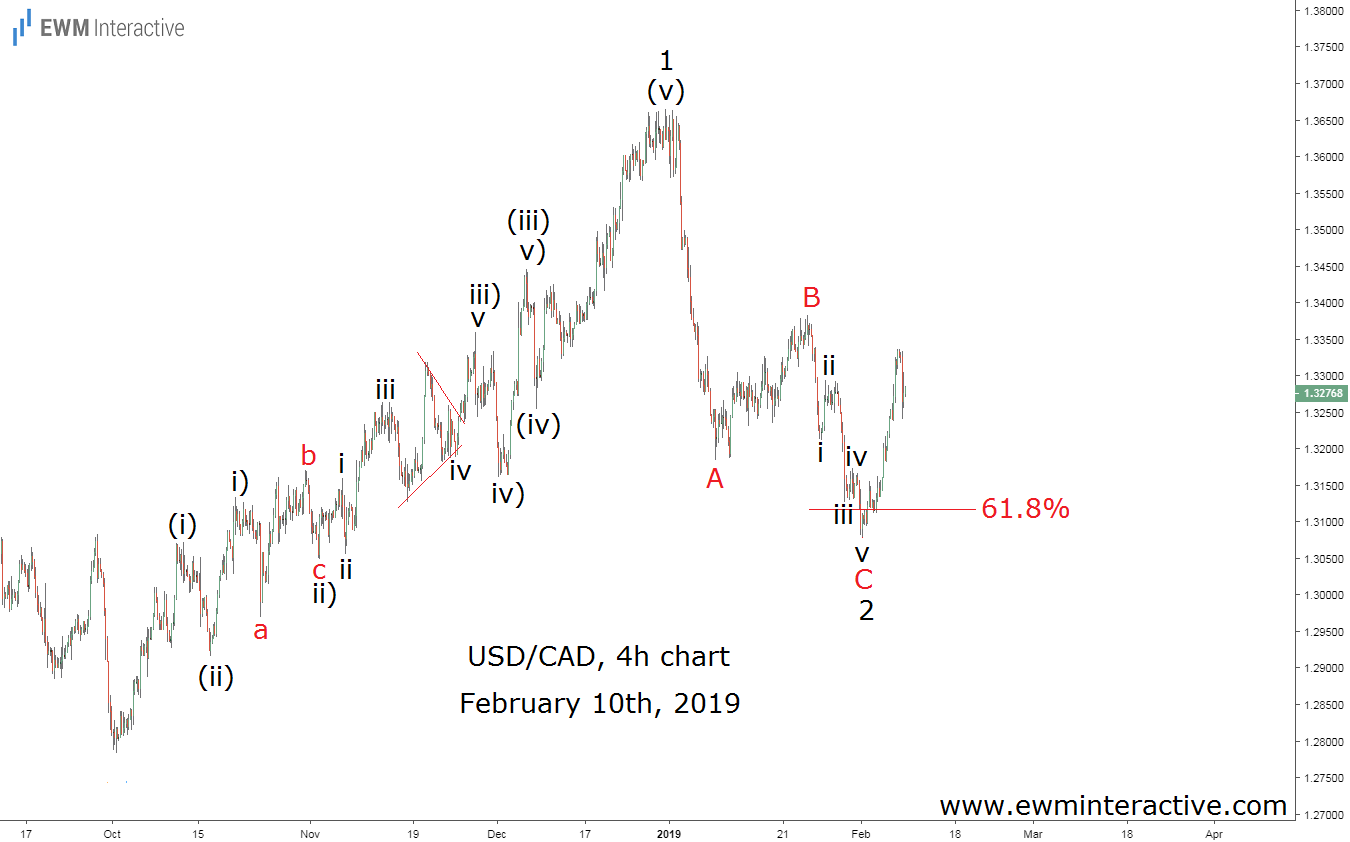
USDCAD 4 Hour Chart February 10th 2019

Wave B managed to lift USD/CAD to 1.3376 on January 24th. Then the bears returned to finish their job. Wave C fell to 1.3069, slightly breaching the 61.8% Fibonacci level. And just when the bears’ roar was getting too loud to ignore, the pair reversed to the upside and climbed to 1.3329 so far.

Elliott Wave analysis has its limitations. For instance, we could not have identified the exact termination points of waves B and C in advance. We doubt that a method that can do that even exists. But the Wave principle’s ability to provide a road map to navigate traders through market uncertainty is what makes this method the Cadillac of technical analysis.

Original post

Latest comments

Risk Disclosure: Trading in financial instruments and/or cryptocurrencies involves high risks including the risk of losing some, or all, of your investment amount, and may not be suitable for all investors. Prices of cryptocurrencies are extremely volatile and may be affected by external factors such as financial, regulatory or political events. Trading on margin increases the financial risks.
Before deciding to trade in financial instrument or cryptocurrencies you should be fully informed of the risks and costs associated with trading the financial markets, carefully consider your investment objectives, level of experience, and risk appetite, and seek professional advice where needed.
Fusion Media would like to remind you that the data contained in this website is not necessarily real-time nor accurate. The data and prices on the website are not necessarily provided by any market or exchange, but may be provided by market makers, and so prices may not be accurate and may differ from the actual price at any given market, meaning prices are indicative and not appropriate for trading purposes. Fusion Media and any provider of the data contained in this website will not accept liability for any loss or damage as a result of your trading, or your reliance on the information contained within this website.
It is prohibited to use, store, reproduce, display, modify, transmit or distribute the data contained in this website without the explicit prior written permission of Fusion Media and/or the data provider. All intellectual property rights are reserved by the providers and/or the exchange providing the data contained in this website.
Fusion Media may be compensated by the advertisers that appear on the website, based on your interaction with the advertisements or advertisers.
© 2007-2024 - Fusion Media Limited. All Rights Reserved.