The increasing turbulence in the bond market finally caused our long ride on the equity wave to end. Our virtual worry-free ride was almost two years in duration. We could see the rocks of volatility building under the surface as a red hot global economy stoked the ripples of inflation. Eventually the exponential move in interest rates of all durations and geographies just became too much for equities to bear and we were thrown from our board.
So where do we go from here?
Until the global economies begin to cool, it seems more than certain that interest rates will continue their upward trajectory. And, we are seeing plenty of evidence in Q1 earnings call notes that wages and freight/shipping costs are on the rise. For companies to improve their margins, they will need to increase their use of technology and grab efficiencies wherever they can; and they will need to idle or sell underperforming assets and capacity. The best news right now is that credit spreads are tight and lending problems are minimal. Companies can easily find debt and equity capital to expand if they want to. Current equity and risk asset prices are getting a good dunking right now, but they will bob back to the surface and get on their boards again. The next question will be how long will stocks have to paddle before they find another good set of waves to ride. Hopefully not too long.
To receive this weekly briefing directly to your inbox, subscribe now.
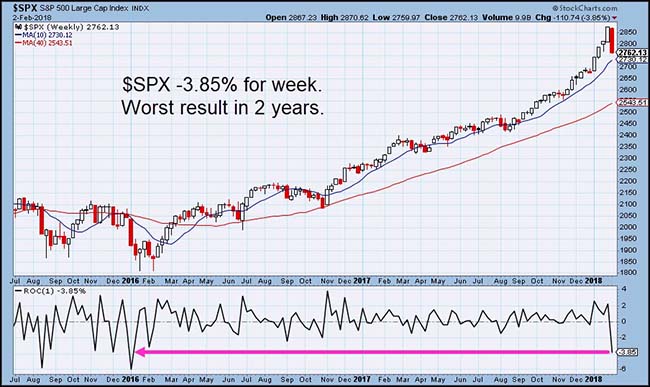
Results from Friday showed the market had its worst weekly pullback in two years…
Looking at the early numbers on Monday hints that this figure might be challenged again this week.
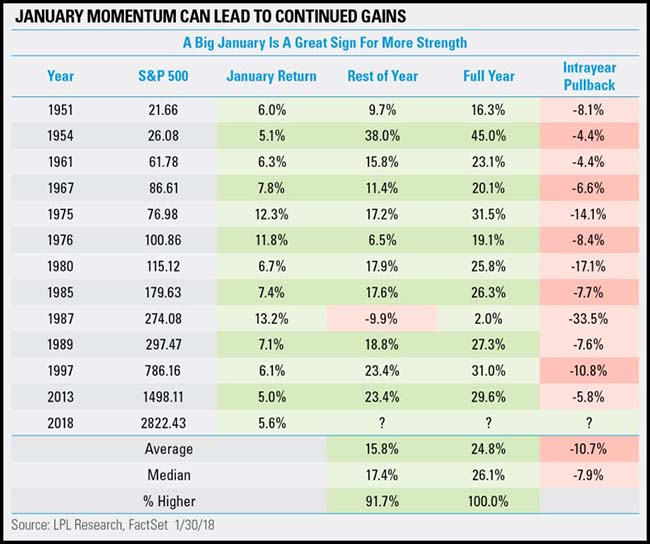
And a reminder that while a big January market typically leads to a positive year, it is not always a smooth ride…
Plenty of double digit drawdowns to be wary of during those great years.
What was the straw that broke the bond market's back?
We knew that job cost inflation was bubbling, but Friday’s job report was a big two-by-four to the face (Chris Farley style).
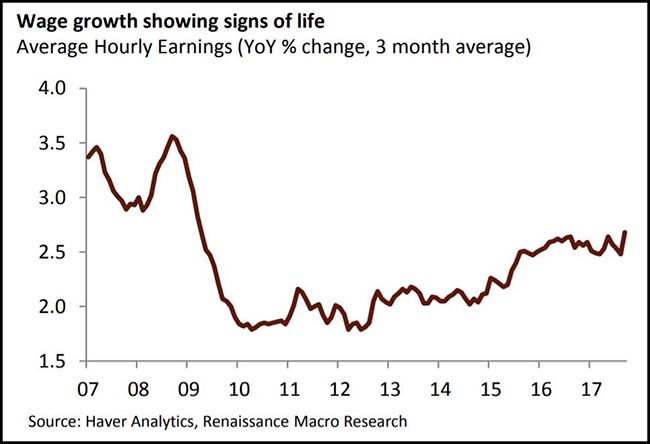
Wages were the final piece to the puzzle…
Like cracks appearing in a dam wall, the repercussions of rising bond yields is registering beyond the ranks of interest rate investors. Equities, currencies and Emerging Markets) are all showing signs of investor anxiety as “risk-free” government benchmarks head north.
News that US average earnings grew at their fastest pace since 2009 was the latest shock for bond traders who duly pushed the 10-Year Treasury yield beyond 2.80 per cent last week.
Rising wages has been one of the missing elements of the US economic recovery. Now the bond market is looking at whether the Federal Reserve is possibly falling behind the curve and needs to accelerate the pace of tightening policy. High-flying equities face the question of margin pressure from higher wages, while also taking a hit from rising bond yields.
Here is the parabolic chart of the U.S. 10-year Treasury yield…
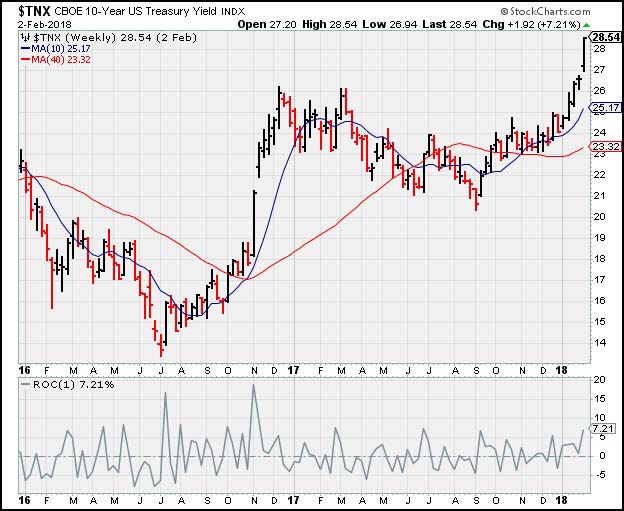
Jeffrey Gundlach drawing the trendline toward 4% yields?
"It seems the tradable buy on bonds will need a flight-to-safety bid on a wave of fear washing over risk markets,” Gundlach told Reuters late on Saturday. “Hard to love bonds at even 3 percent when GDPNow for Q1 2018 is suggesting annualized nominal GDP growth above 7 percent."
(Reuters)
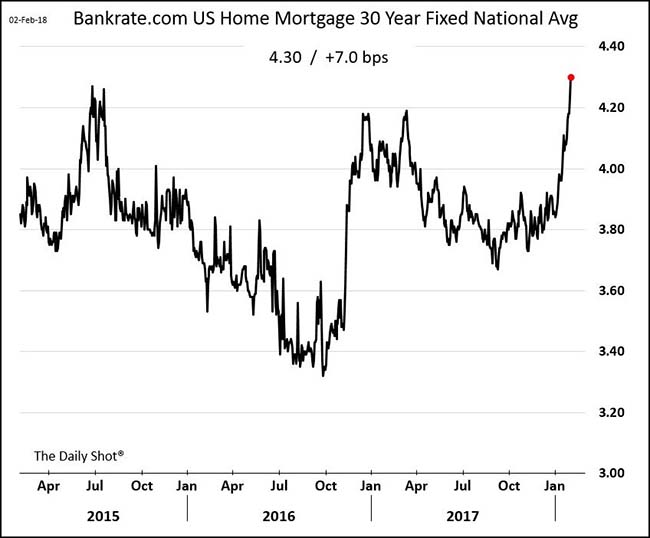
The one yield that Americans care about the most…
(@SoberLook)
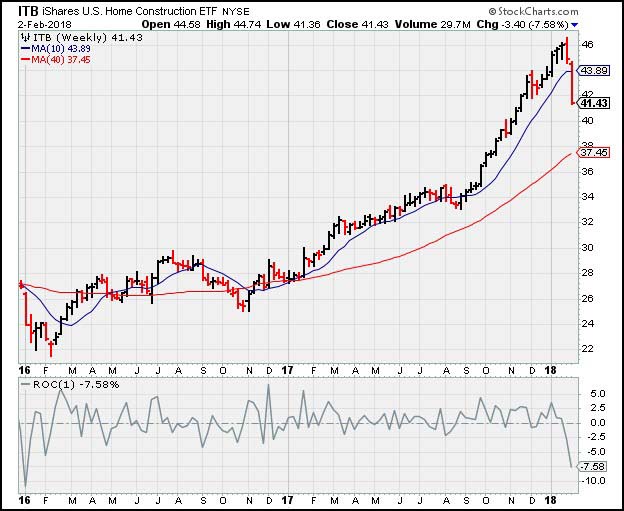
Higher mortgage rates will slow down housing demand…
An increase from 4 to 5 percent for a 30-year mortgage, for example, would drive up monthly bills by 12 percent. Right now, the average 30-year mortgage rate is 4.22 percent, its highest in about a year, according to data from Freddie Mac, and not far off from a four-year high of 4.33 percent. The 30-year mortgage rate tends to track the path of the 10-year Treasury yield, which is already at its highest level since January 2014.
Which explains why higher rates are now taking the excitement out of Ihousing and building materials equities…
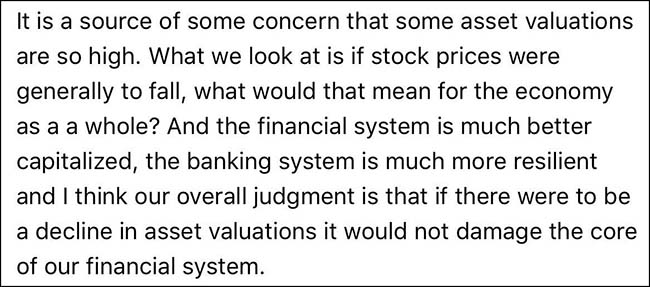
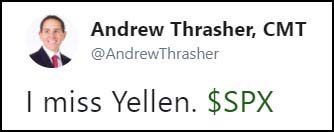
Exiting Fed Chair Janet Yellen had some final comments in her exit interviews…
Cautionary on valuations, while favorable on the health of the overall system.
(@CBSSunday)
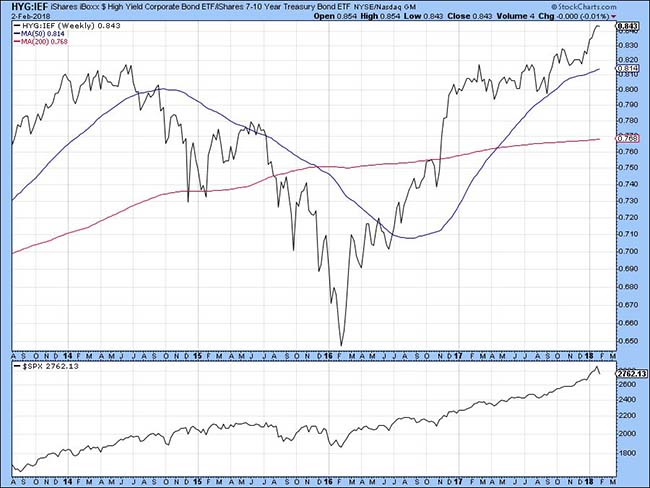
The best news for risk-seeking investors is that the appetite for credit remains high…
This chart shows the performance of High Yield Bonds versus Treasurys. If it was breaking, I would be ringing the bell just as I did in 2014 and 2015. But for now, all is good.
The worry is that maybe everything is a bit too good…
So much green as almost all country PMIs are greater than 50.
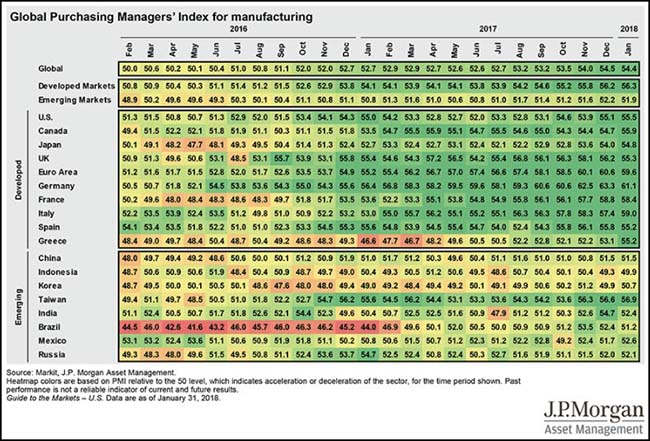
Maybe too good example #1?
For German businessman Ralf Schlesselmann, these are heady times, “We’re totally maxing out,” he says.
Mr Schlesselmann runs a 100-year-old family-owned wooden-pallet maker in Asendorf near Hanover that is working almost round the clock to cope with surging orders. “We’re seeing increased demand from all sectors,” he says. “We’re at very close to full capacity.”
The humble wooden pallet is an unremarkable thing. But it is also a “heart-rate monitor for the whole economy,” says Jan Kurth, head of the HPE, the main trade body for Germany’s export packaging companies. Manufacturers of all stripes need them to stack, store and move their goods, and the more they produce, the more they need.
Germany is producing at full pelt. Its economy grew 2.2 per cent last year — the highest rate since 2011, driven by strong domestic demand and a recovery in the eurozone. The trend looks set to continue — economists expect the country to see its ninth consecutive year of growth in 2018.
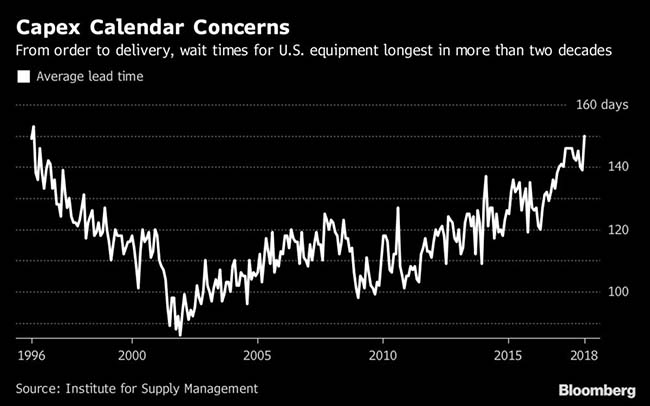
Maybe too good example #2?
America’s factories are having trouble keeping up with demand. The average lead time for capital expenditures increased 7.9 percent in January to 150 days, the longest since February 1996, data from the Institute for Supply Management showed Thursday. The pickup underscores a flurry of business investment that’s coincided with elevated confidence, lower U.S. tax rates, strengthening global economies and efforts to improve operating efficiency.
Lots of capital chasing M&A deals so far in 2018 will provide equity market support in the near term…
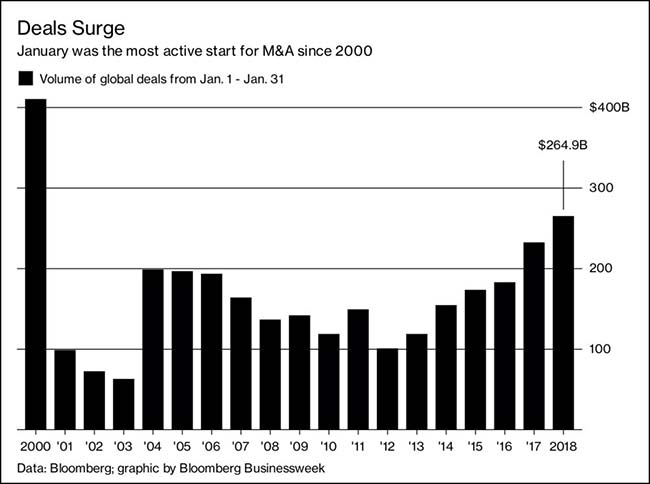
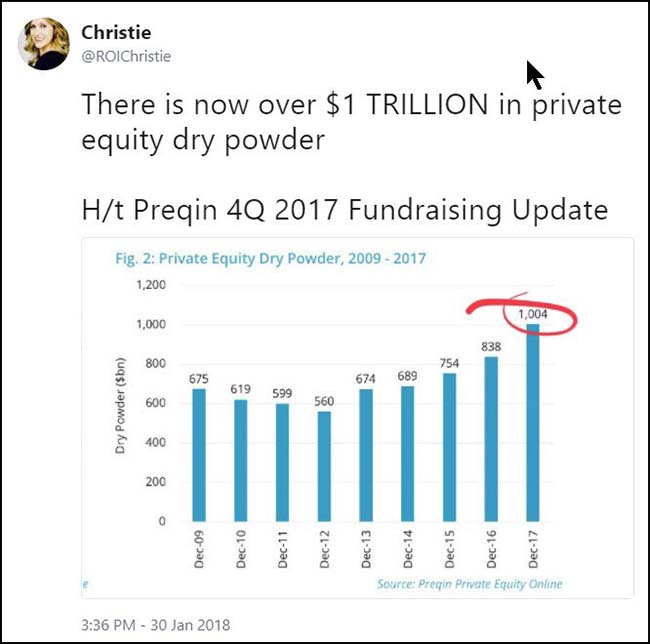
And plenty of capital to support further buying as the year progresses…
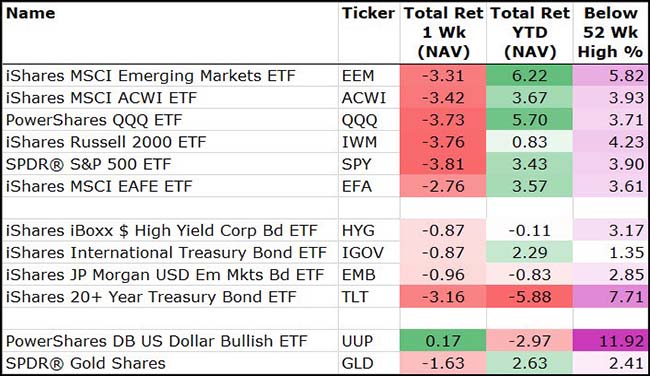
For last week, risk assets were down across the board with only the U.S. Dollar gaining…
Too soon?
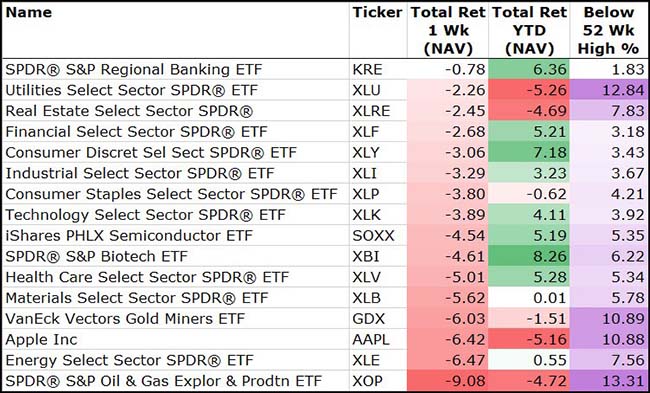
Among the Sectors, another declining week…
Utilities, Gold Miners) and Oil E&P) join Apple (NASDAQ:AAPL) in -10% correction territory.
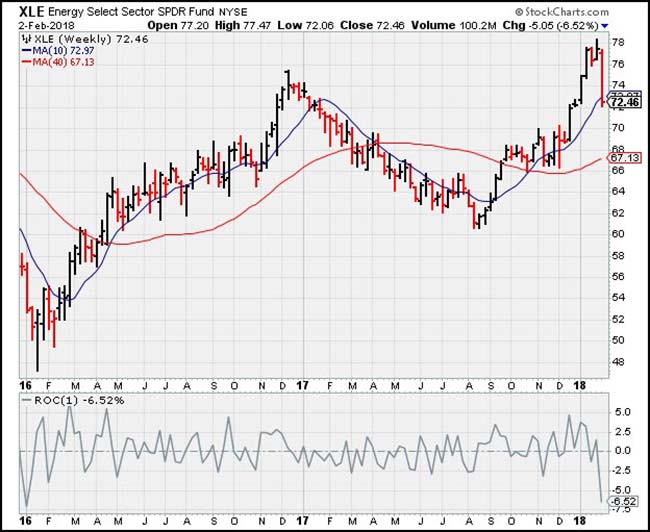
One of the more surprising sharp declines last week was in the Energy sector…
Oil Prices were little changed but earnings disappointments out of Exxon Mobile (NYSE:XOM) and Chevron (NYSE:CVX) just wrecked the group on Friday.
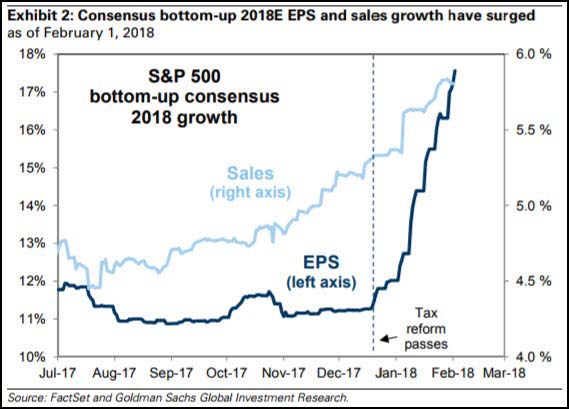
Speaking of earnings, the data for the largest week of the quarter continues to trend in the right direction…
To date, 50% of the companies in the S&P 500 have reported actual results for Q4 2017. In terms of earnings, more companies are reporting actual EPS above estimates (75%) compared to the five-year average. In aggregate, companies are reporting earnings that are 4.0% above the estimates, which is below the five-year average. In terms of sales, more companies (80%) are reporting actual sales above estimates compared to the five-year average. If 80% is the final number for the quarter, it will mark the highest percentage of S&P 500 companies reporting positive sales surprises since FactSet began tracking this metric in Q3 2008. In aggregate, companies are reporting sales that are 1.4% above estimates, which is also above the five-year average.
(Factset)
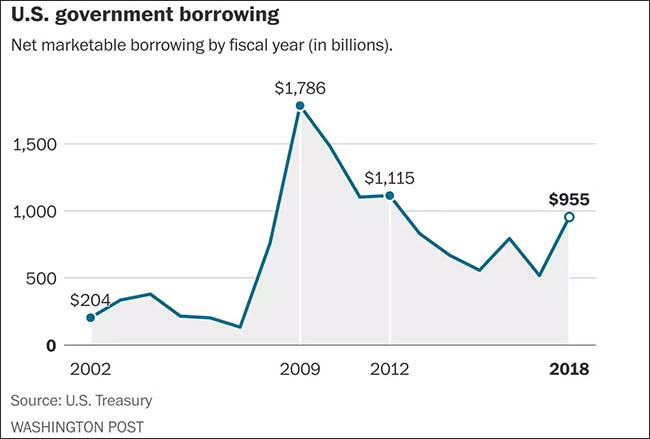
Washington Post: Analysis: The U.S. government is set to borrow nearly $1 trillion this year, an 84 percent jump from last year
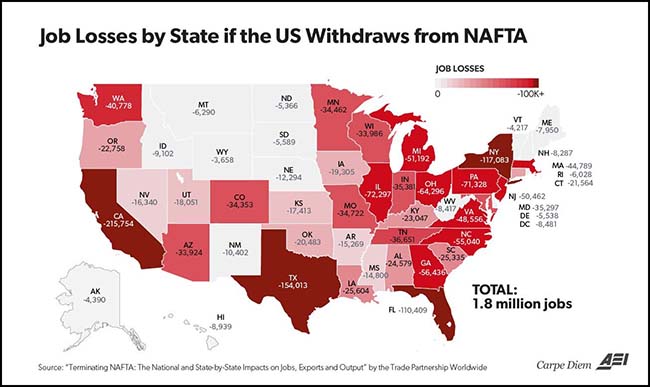
NAFTA’s future remains uncertain. An elimination would be one way to cool the U.S. economy…
@Mark_J_Perry: MAP: Job Losses by State if US Withdraws from NAFTA, Total = -1.8M US jobs according to new research from @TradePartnersDC and @BizRoundtable
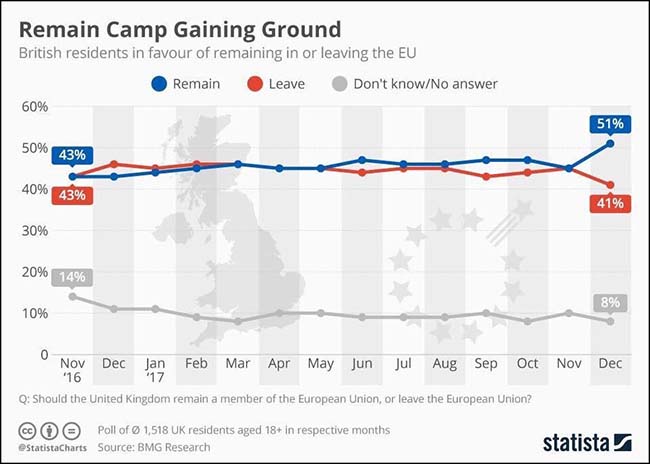
Second thoughts in the U.K. as jobs head overseas and local prices rise?
(@statistacharts)
Seriously?
‘Bitcoin is my potential pension’: What’s driving people in Kentucky to join the craze?
He had invested in bitcoin almost two years earlier, so now Jacob Melin had a new house, a new truck, a new consulting business and a line of people coming into his office, trying to become wealthy as quickly as he had. One person said he expected to use a modest investment to “retire in 12 to 18 months.” Another said he wanted to use the proceeds to start a business. And a father of two talked about paying off his own student loans and buying several acres of land — all the things he did not see a chance to do with his income as a software salesman.
“Us little guys working our butts off, we can’t get ahead,” Cedric Knight, 35, told Melin. “This is a once-in-a-lifetime opportunity to change my life.”
The information presented here is for informational purposes only, and this document is not to be construed as an offer to sell, or the solicitation of an offer to buy, securities. Some investments are not suitable for all investors, and there can be no assurance that any investment strategy will be successful. The hyperlinks included in this message provide direct access to other Internet resources, including Web sites. While we believe this information to be from reliable sources, 361 Capital is not responsible for the accuracy or content of information contained in these sites. Although we make every effort to ensure these links are accurate, up to date and relevant, we cannot take responsibility for pages maintained by external providers. The views expressed by these external providers on their own Web pages or on external sites they link to are not necessarily those of 361 Capital.

