While there are wide-ranging and contradictory assessments as to the U.S. economy’s future performance and the adverse impact of the still unfolding Euro-zone crisis. The charts below graphically indicate improvement in some key parameters of the U.S. economy over the past 12 months. I use September 2011 as a starting point, set the actual data as of that date to 100 and present all subsequent data as a multiple of the September 2011 level.
Over the past 12 months, consumer confidence has risen by ~50% and retail sales have increased ~5%:
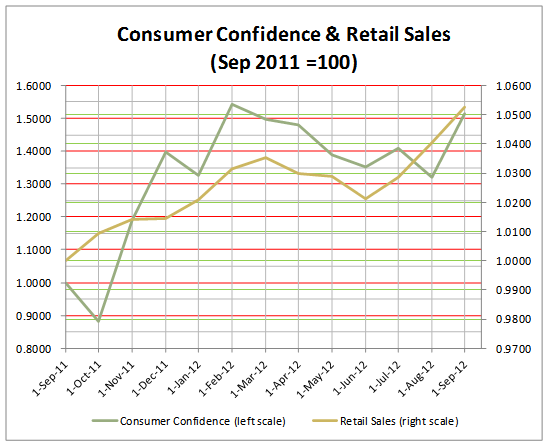
Chart 1: Consumer Confidence and Retail Sales (Sep 2011 = 100)
Over the past 12 months, industrial production and shipment of manufactured goods have increased by ~2.5%:
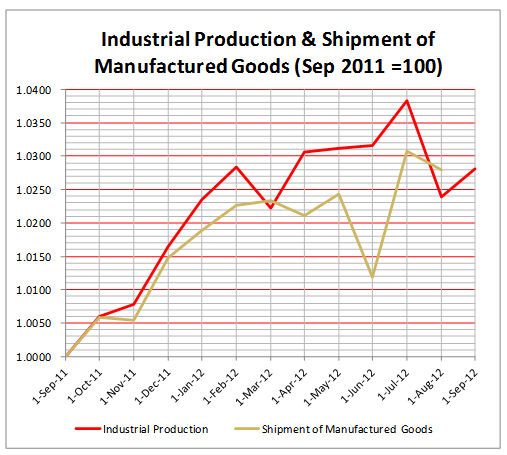
Chart 2: Industrial Production & Shipments of Manufactured Goods (Sep 2011 = 100)
Over the past 12 months, housing starts and new home sales have increased by ~25% to 35%:

Chart 3: Housing Starts and New Home Sales (Sep 2011 = 100)
Over In the last 12 months, unemployment has dropped from 9% to 7.8%. While the overall level is still high, data from the U.S. Bureau of Labor Statistics indicates the number of people unemployed has decreased from 13.9 to 12.1 million over the past year.
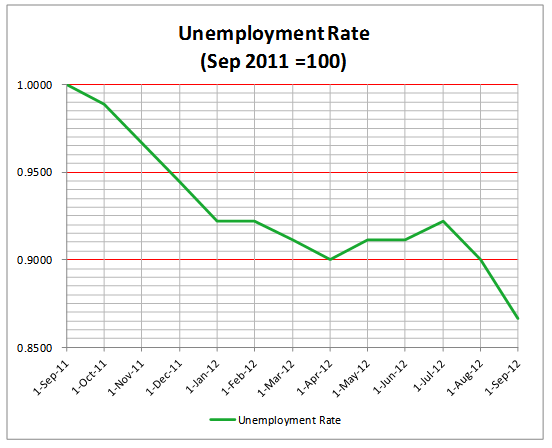
Chart 4: Unemployment Rate (Sep 2011 = 100)
Overall, year-to-date GDP growth has improved in 2012 over 2011:

From September 2011 to September 2012, both the S&P 500 Total Return Index and the Alerian MLP Index, a composite of the 50 most prominent energy MLPs, calculated on a total return basis (“AMZX”), registered significant gains (~30% and 26%, respectively):
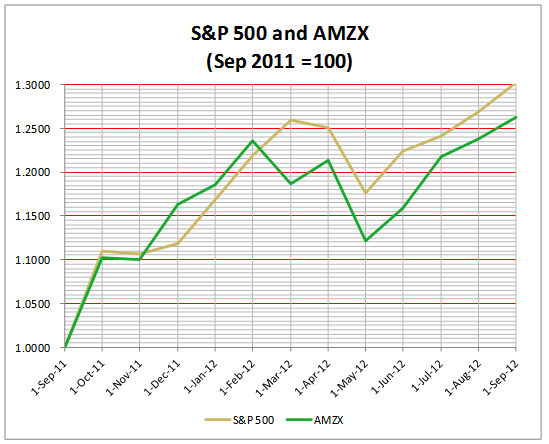
Chart 5: S&P 500 and the Alerian MLP Index (Sep 2011 = 100)
While over the long term (1996 to date), AMZX has generated total returns far superior to those generated by the S&P 500, the excess performance trend line has been declining::
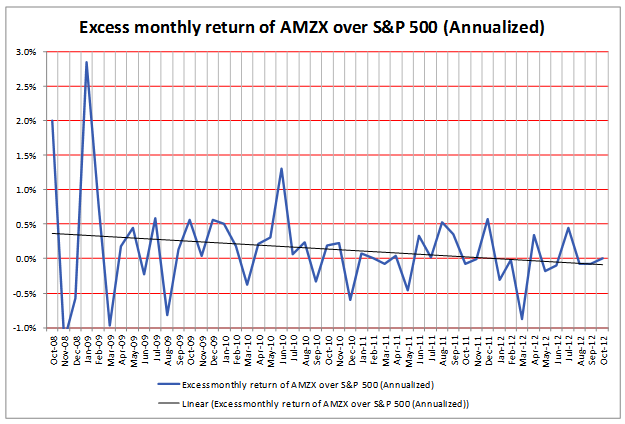
Chart 6: Excess monthly returns of AMZX over S&P 500 Total Return Index (annualized)
So far in 2012 (through 10/26/12), the S&P 500 Total return Index is up 14.3% while the AMZX is up 9.1%. Table 1 below enables comparison of the total return produced by each of the thirteen MLPs I have reviewed to date for the latest 12 months through 10/26/12 to the S&P 500 Total Return Index (up 12.4%) and the AMZX benchmark (up 15.2%).
The 13 MLPs:
El Paso Pipeline Partners (EPB)
Enterprise Products Partners (EPD)
Energy Transfer Partners (ETP)
Plains All American Pipeline (PAA)
Buckeye Partners (BPL)
Targa Resources Partners (NGLS)
Regency Energy Partners (RGP)
Inergy LP (NRGY)
Williams Partners (WPZ)
Magellan Midstream Partners (MMP)
Kinder Morgan Energy Partners (KMP)
Boardwalk Pipeline Partners (BWP)
Suburban Propane Partners (SPH)
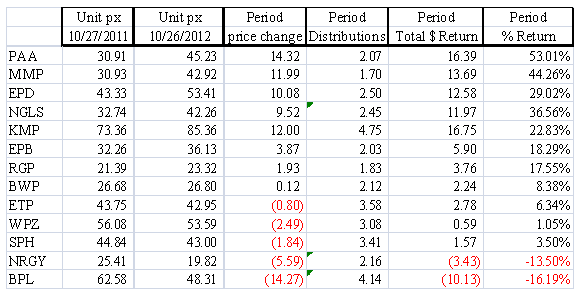
Table 1: Comparing Trailing Twelve Months returns of 13 MLPsAlerian MLP Index
Over the past 12 months, consumer confidence has risen by ~50% and retail sales have increased ~5%:

Chart 1: Consumer Confidence and Retail Sales (Sep 2011 = 100)
Over the past 12 months, industrial production and shipment of manufactured goods have increased by ~2.5%:

Chart 2: Industrial Production & Shipments of Manufactured Goods (Sep 2011 = 100)
Over the past 12 months, housing starts and new home sales have increased by ~25% to 35%:

Chart 3: Housing Starts and New Home Sales (Sep 2011 = 100)
Over In the last 12 months, unemployment has dropped from 9% to 7.8%. While the overall level is still high, data from the U.S. Bureau of Labor Statistics indicates the number of people unemployed has decreased from 13.9 to 12.1 million over the past year.

Chart 4: Unemployment Rate (Sep 2011 = 100)
Overall, year-to-date GDP growth has improved in 2012 over 2011:

From September 2011 to September 2012, both the S&P 500 Total Return Index and the Alerian MLP Index, a composite of the 50 most prominent energy MLPs, calculated on a total return basis (“AMZX”), registered significant gains (~30% and 26%, respectively):

Chart 5: S&P 500 and the Alerian MLP Index (Sep 2011 = 100)
While over the long term (1996 to date), AMZX has generated total returns far superior to those generated by the S&P 500, the excess performance trend line has been declining::

Chart 6: Excess monthly returns of AMZX over S&P 500 Total Return Index (annualized)
So far in 2012 (through 10/26/12), the S&P 500 Total return Index is up 14.3% while the AMZX is up 9.1%. Table 1 below enables comparison of the total return produced by each of the thirteen MLPs I have reviewed to date for the latest 12 months through 10/26/12 to the S&P 500 Total Return Index (up 12.4%) and the AMZX benchmark (up 15.2%).
The 13 MLPs:
El Paso Pipeline Partners (EPB)
Enterprise Products Partners (EPD)
Energy Transfer Partners (ETP)
Plains All American Pipeline (PAA)
Buckeye Partners (BPL)
Targa Resources Partners (NGLS)
Regency Energy Partners (RGP)
Inergy LP (NRGY)
Williams Partners (WPZ)
Magellan Midstream Partners (MMP)
Kinder Morgan Energy Partners (KMP)
Boardwalk Pipeline Partners (BWP)
Suburban Propane Partners (SPH)

Table 1: Comparing Trailing Twelve Months returns of 13 MLPsAlerian MLP Index
