Revenues, operating income, net income and earnings before interest, depreciation and amortization and income tax expenses (EBITDA) reported by Magellan Midstream Partners, L.P. (MMP) for 4Q12, 2012 and prior periods are summarized in Table 1:
All the operating parameters in Table 1 exhibited modest increases in 2012 vs. 2011. In the last 3 years MMP has not increased significantly the number of limited partner units outstanding, a significant accomplishment when compared to most of the master limited partnerships (“MLPs”) that I follow.
Effective January 1, 2013, MMP has redesigned its internal management reports to correspond to a new organizational structure that reflects redefined reporting segments. The new reporting segments are: 1) refined products pipeline and terminals; 2) crude pipeline and terminals; and 3) marine storage.
The refined products pipeline and terminals segment incorporates most of MMP’s petroleum pipeline system, the inland terminals and the ammonia pipeline system.
The crude pipeline and terminals segment: incorporates: a) the Crane-to-Houston crude pipeline reversal project; b) the Cushing pipeline and terminal; c) the South Texas crude pipeline; d) the crude components of the East Houston (Corpus Christi) terminal; e) the condensate components of the Corpus Christi, Texas terminal; f) the Gibson, Louisiana terminal; and g) equity earnings of the Osage pipeline, the Double Eagle pipeline, and the BridgeTex pipeline.
The marine storage segment incorporates the six petroleum terminals that have marine access and are located near major refining hubs along the U.S. Gulf and East Coasts.
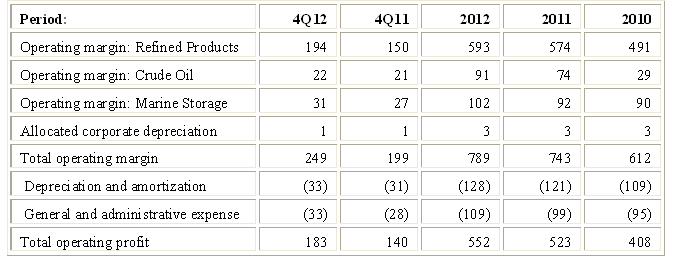
Segment operating margins are shown in Table 2 below: 
The bulk of the operating margins seen in Table 2 are generated by fee-based transportation and terminals services, with commodity-related activities contributing 15% or less of MMP’s operating margin.
MMP’s definition of Distributable Cash Flow (“DCF”) and a comparison to definitions used by other master limited partnerships (“MLPs”) are described in one of my prior articles. Using that definition, DCF in 2012 was $540 million ($2.38 per unit), up from $461 million ($2.03 per unit) in 2011. As always, I first attempt to assess how these figures compare with what I call sustainable DCF for these periods and whether distributions were funded by additional debt or issuing additional units.
The generic reasons why DCF as reported by the MLP may differ from sustainable DCF are reviewed in an article titled "Estimating Sustainable DCF-Why and How." Applying the method described there to MMP generates the comparison outlined in Table 3 below: 
Management’s initial 2012 DCF target was $490 million. This target was subsequently raised to $525 million and the $540 million actually achieved surpassed even that. Management currently projects MMP will generate $570 million of DCF in 2013 and is targeting 10% distribution growth for both 2013 and 2014.
The principal differences of between sustainable and reported DCF numbers are attributable to risk management activities. I do not generally consider cash generated by risk management activities to be sustainable, although I recognize that one could reasonable argue that bona fide hedging of commodity price risks should be included. MMP’s risk management activities seem to be directly related to such hedging, so I could go both ways on this. In any event, the differences between reported and sustainable DCF in the periods under are not material.
Coverage ratios appear strong, as indicated in Table 4 below: 
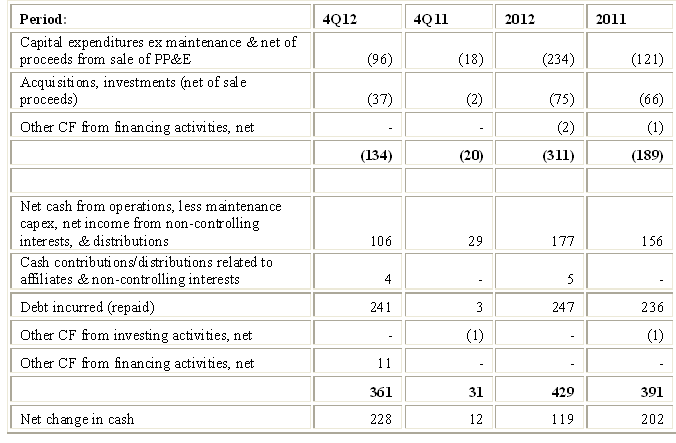
The simplified cash flow statement in the table below gives a clear picture of how distributions have been funded in the last two years. The table nets certain items (e.g., debt incurred vs. repaid) and separates cash generation from cash consumption.
Simplified Sources and Uses of Funds 
The numbers indicate solid, sustainable, performance. Net cash from operations, less maintenance capital expenditures, less cash related to net income attributable to non-partners exceeded distributions by $177 million in 2012 and by $156 million in 2011. MMP is not using cash raised from issuance of debt and equity to fund distributions. The excess enables MMP to reduce reliance on the issuance of additional partnership units or debt to fund expansion projects. The cash balance at year-end ($328 million) represents an extraordinarily high level relative to past periods. Given the importance of certain expansion projects discussed below, management believes it prudent “to keep a bit more cushion to allow these large-scale projects more than adequate time to come online safely and reliably”.
In over two years (since 3Q 2010), MMP has not issued additional partnership units (excluding units issued in connection with compensation arrangements), a rare achievement in the MLP universe. Also, MMP’s net income per unit in 3012 exceeded that year’s distributions ($1.92 vs. $1.8763). That too is a rare achievement for an MLP, all the more because of its consistency (net income equaled or exceeded distributions in all but 3 of the past 12 quarters).
MMP spent $199 million and $365 million on acquisitions and growth projects during 2011 and 2012, respectively. It currently expect to spend ~$700 million in 2013 on projects now underway, with additional spending of approximately $290 million in 2014 to complete these projects. These expansion capital estimates exclude potential acquisitions or spending on more than $500 million of other potential growth projects in earlier stages of development.
Of the projects currently under way, the conversion of a large portion of the partnership’s Houston-to-El Paso pipeline to crude oil service is of particular note. At $375 million, this is the largest organic growth project ever undertaken by MMP. The reversed pipeline system will transport crude oil from Crane, Texas, to refiners or third-party pipelines in Houston and Texas City, Texas. Pipeline capacity will be 225,000 barrels per day and the entire capacity is 90% subscribed with Permian Basin production (10% of capacity is set aside for spot shippers). Subject to receiving the necessary permits and regulatory approvals, MMP will begin moving at least 75,000 barrels a day of crude oil to Houston in early 2013 and increase to the full 225,000 barrels a day capacity in the second half of 2013. The reversed pipeline is expected to have a materially favorable impact on MMP’s results of operations beginning in 2013.
Another major project is the BridgeTex Pipeline Company, LLC (“BridgeTex”), a joint venture formed in November 2012 by MMP and affiliates of Occidental Petroleum Corporation for the purpose of constructing and operating a 400-mile pipeline capable of transporting 300,000 barrels per day of Permian Basin crude oil from Colorado City, Texas for delivery to MMP’s East Houston, Texas terminal; a 50-mile pipeline between East Houston and Texas City, Texas; and approximately 2.6 million barrels of storage. Completion is expected in mid-2014 and MMP expects to spend ~$600 million for its 50% stake in BridgeTex.
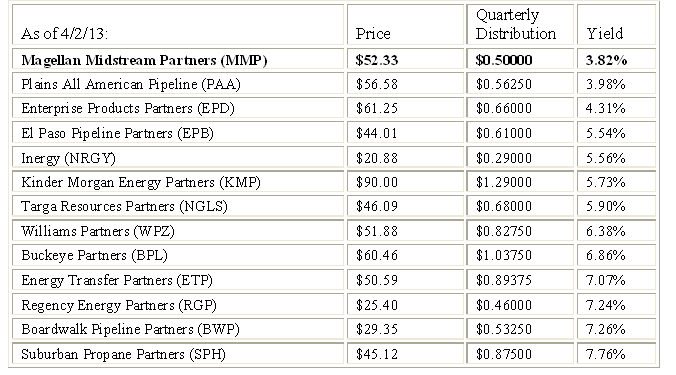
MMP’s current yield is at the lowest end of the MLP universe. A comparison to some of the MLPs I follow is provided in Table 6 below: 
MMP’s premium price may be justified given its performance track record, a management team that is disciplined and unwilling to pay the premiums that other MLPs have been paying for acquisitions, an impressive portfolio of growth projects, advantageous structure (no general partner incentive distributions), ability to generate significant excess cash from operations, and proven ability to minimize limited partner dilution.
- English (UK)
- English (India)
- English (Canada)
- English (Australia)
- English (South Africa)
- English (Philippines)
- English (Nigeria)
- Deutsch
- Español (España)
- Español (México)
- Français
- Italiano
- Nederlands
- Português (Portugal)
- Polski
- Português (Brasil)
- Русский
- Türkçe
- العربية
- Ελληνικά
- Svenska
- Suomi
- עברית
- 日本語
- 한국어
- 简体中文
- 繁體中文
- Bahasa Indonesia
- Bahasa Melayu
- ไทย
- Tiếng Việt
- हिंदी
A Closer Look: Magellan Midstream Partners
Published 04/07/2013, 04:57 AM
Updated 07/09/2023, 06:31 AM
A Closer Look: Magellan Midstream Partners
3rd party Ad. Not an offer or recommendation by Investing.com. See disclosure here or
remove ads
.
Latest comments
Install Our App
Risk Disclosure: Trading in financial instruments and/or cryptocurrencies involves high risks including the risk of losing some, or all, of your investment amount, and may not be suitable for all investors. Prices of cryptocurrencies are extremely volatile and may be affected by external factors such as financial, regulatory or political events. Trading on margin increases the financial risks.
Before deciding to trade in financial instrument or cryptocurrencies you should be fully informed of the risks and costs associated with trading the financial markets, carefully consider your investment objectives, level of experience, and risk appetite, and seek professional advice where needed.
Fusion Media would like to remind you that the data contained in this website is not necessarily real-time nor accurate. The data and prices on the website are not necessarily provided by any market or exchange, but may be provided by market makers, and so prices may not be accurate and may differ from the actual price at any given market, meaning prices are indicative and not appropriate for trading purposes. Fusion Media and any provider of the data contained in this website will not accept liability for any loss or damage as a result of your trading, or your reliance on the information contained within this website.
It is prohibited to use, store, reproduce, display, modify, transmit or distribute the data contained in this website without the explicit prior written permission of Fusion Media and/or the data provider. All intellectual property rights are reserved by the providers and/or the exchange providing the data contained in this website.
Fusion Media may be compensated by the advertisers that appear on the website, based on your interaction with the advertisements or advertisers.
© 2007-2024 - Fusion Media Limited. All Rights Reserved.
