On March 1, 2013, Energy Transfer Partners, L.P. (ETP) provided its 2012 annual report on Form 10-K.
ETP's consolidated financial statements have been retrospectively adjusted to reflect consolidation of the Southern Union Company into ETP beginning March 26, 2012 (the date ETE acquired the Southern Union Company) and the consolidation of Sunoco, Inc. (“Sunoco”) beginning October 5, 2012 (the date ETP acquired it). These consolidations were enabled by the formation of a company called ETP Holdco (“Holdco”), an entity that is owned by ETP and its general partner, Energy Transfer Equity L.P. (“ETE”).
After ETE acquired Southern Union it contributed this asset to Holdco and received, in return, a 60% interest in Holdco. ETP therefore ended up with a 40% economic stake in Southern Union while ETE has 60%.
After ETP acquired Sunoco (on October 5, 2012) it contributed this asset to Holdco and received, in return, a 40% interest in Holdco. ETP ended up with a 40% economic stake in Sunoco while ETE has 60%.
ETP therefore has a 40% economic stake in both Southern Union and Sunoco, while ETE has 60%. However, ETE transferred the ability to control Holdco to ETP. The logic of why ETP can claim that it really controls Holdco escapes me (since ETE controls ETP), but nevertheless, it is ETP (rather than ETE) that consolidates both Southern Union and Sunoco. This serves ETE’s desire to become more of a “pure” general partner play.
The main asset purchased via the $2 billion Southern Union acquisition was a 50% joint venture interest in Citrus Corp., an entity that owns 100% of the Florida Gas Transmission (“FGT”) pipeline system (a 5,400 mile pipeline system that extends from south Texas through the Gulf Coast to south Florida). The other 50% of FGT is owned by Kinder Morgan, Inc. (KMI). FGT
The main assets purchased via the $5.3 billion Sunoco acquisition were the retail marketing operations (that sell gasoline and middle distillates at retail service stations and operate convenience stores in 25 states) and the refined product and crude oil transportation operations of Sunoco Logistics Partners L.P. (“SXL”). ETP's interests in Sunoco Logistics consist of a 2% general partner interest, 100% of the incentive distribution rights (“IDR”) and 33.53 million SXL units representing ~32% of the limited partner interests as of December 31, 2012. Because ETP became the owner of the general partner of SXL when it acquired Sunoco, in 4Q12 it began consolidating SXL in its financial statements as well as consolidating the results of Sunoco’s retail marketing operations.
If I correctly understand the complex set of Holdco transactions outlined above, I would describe it as an “apples for oranges” exchange: ETE transferred to ETP 40% of the economic interests it acquired via the $2 billion Southern Union acquisition in exchange for ETP transferring to ETE 60% of the economic interests it acquired via the $5.3 billion Sunoco acquisition. Time will tell how fair this exchange was. In principle, from a conflicts perspective it is no different to drop-down transactions typical of master limited partnerships (“MLPs”) that have general partners with significant operational assets.
But these are not the only factors that make the ETP financials difficult to analyze. ETP considers Segment Adjusted EBITDA to be an important performance measure of the core profitability of its operations. It forms the basis of ETP’s internal financial reporting and is one of the performance measures used by senior management in deciding how to allocate capital resources among business segments. In 4Q12 management changed its definition of Segment Adjusted EBITDA to reflect amounts for less than wholly owned subsidiaries based on 100% of the subsidiaries' results of operations. In prior periods, NGL Transportation and Services was the only segment that included a less than wholly owned subsidiary - the Lone Star joint venture with Regency Energy Partners, L.P. (RGP). But in future periods Segment Adjusted EBITDA will also include 100% of FGT and 100% of the Fayetteville Express Pipeline (“FEP”) even though ETP owns 50% of these ventures and previously accounted for them using the equity method).
Key operating parameters are summarized in Table 1 below: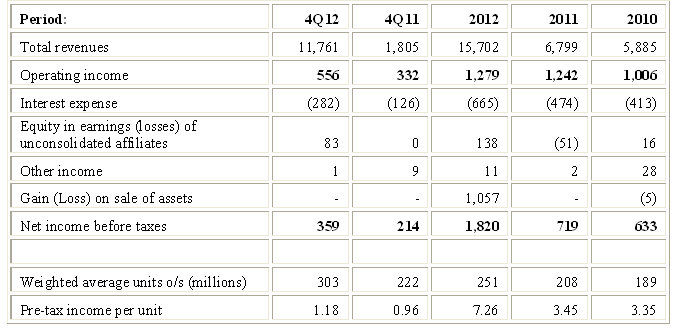
Pre-tax income per unit in 2012 benefited from a $1,057 million gain on the sale of the retail propane business to AmeriGas Partners, L.P. (APU). Excluding that, the 2012 pre-tax income per unit would have been $3.04.
Segment Adjusted EBITDA is summarized in Table 2 below: 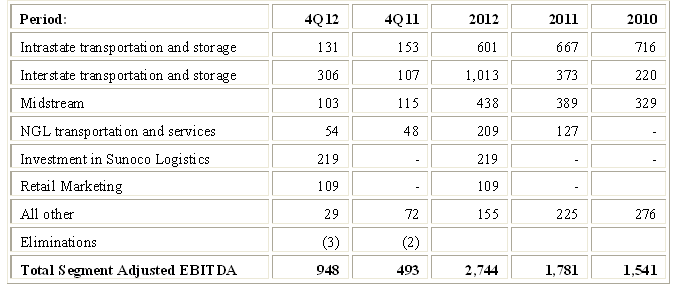
The $66 million decline in Intratstate’s Segment Adjusted EBITDA in 2012 resulted from decreases in transport volumes, retention volumes and gross margins due to a less favorable natural gas price environment (decline in the average of natural gas spot prices), the cessation of certain long-term contracts, and lower basis differentials primarily between the West and East Texas hubs.
The $640 million improvement in Interstate’s Segment Adjusted EBITDA in 2012 was driven by: 1) higher revenues (an increase of $662 million of which the consolidation of Southern Union's transportation and storage businesses beginning March 26, 2012, accounts for $592 million); 2) greater contribution from unconsolidated affiliates higher (an increase of $251 million, primarily reflecting the acquisition of a 50% interest in Citrus); and offset by 3) a $273 million increase in expenses, primarily related to the Southern Union consolidation).
The $49 million improvement in the Midstream’s segment Adjusted EBITDA in 2012 was driven by higher gross margins (up $181 million), offset by higher expenses ($122 million, primarily expenses related to the consolidation of Southern Union's gathering and processing operations) and other items. However, $101 million of the gross margin improvement was non-fee based and resulted from a $125 million increase attributed to non fee-based contracts recorded in connection with the consolidation of Southern Union's gathering and processing business from March 26, 2012 through December 31, 2012.
The NGL Transportation and Services segment reflects the results from Lone Star JV which acquired the membership interests in LDH on May 2, 2011 (it also includes other wholly-owned or joint venture pipelines that have recently become operational). The $82 million improvement in the segment’s Adjusted EBITDA reflects twelve months of activity compared to only eight months of activity in 2011.
Management noted it obtained control of Sunoco (including SXL) on October 5, 2012 and therefore provided no comparative results for the Sunoco Logistics segment. The $219 million adjusted EBITDA generated distributable cash flow of $154 million. ETP‘s share of cash distributions consists of its 2% general partner interest, its 32% limited partner interest and its IDRs.
For the same reason cited in the paragraph above, no comparative results for the Retail Marketing segment were provided. But in a prior article discussing this acquisition, I noted that the EBITDA figure cited by management for 2011 was $261 million, on top of which $70 million in future synergies were expected over time. So the $109 million Adjusted EBIDTA achieved in 4Q12 seems excellent relative to prior expectations. Management noted gross margins were higher than traditionally seen and cautioned against extrapolating from 4Q12 results.
Prior to 2012 the “All Other” segment consisted primarily of retail propane and other retail propane business. In 2012 this segment consisted primarily of: 1) the retail propane operations prior to their contribution of those operations to AmeriGas Partners, L.P. ("AmeriGas") in January 2012 and the investment in AmeriGas for the balance of the year; 2) Southern Union's local distribution operations beginning March 26, 2012; 3) the natural gas compression operations; and 4) Sunoco's ~30% non-operating interest in a joint venture with The Carlyle Group, L.P. which owns a refinery in Philadelphia.
In an article titled "Distributable Cash Flow (“DCF”)" I present the definition of DCF used by ETP and provide a comparison to definitions used by other MLPs. Using ETP’s definition, DCF for 2012 was $5.97 per unit ($1,488 million), up from $5.54 per unit ($1,153 million) for the comparable prior year period. As always, I first attempt to assess how these figures compare with what I call sustainable DCF for these periods and whether distributions were funded by additional debt or issuing additional units.
The generic reasons why DCF as reported by the MLP may differs from call sustainable DCF are reviewed in an article titled “Estimating sustainable DCF - why and how.” Applying the method described there to ETP results generates the comparison outlined in Table 3 below: 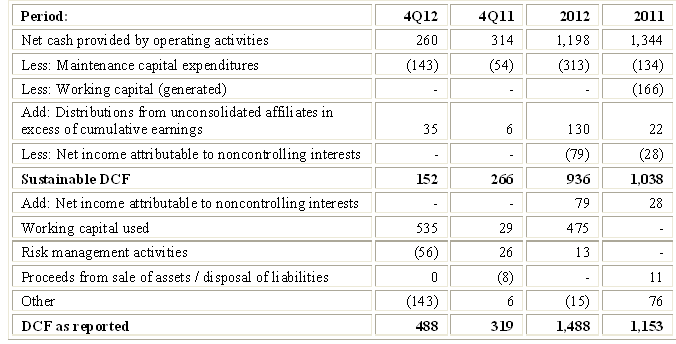
For 2012, the differences between reported DCF and sustainable DCF in 2012 relate to working capital. Under ETP’s definition, reported DCF always excludes working capital changes, whether positive or negative. My definition of sustainable DCF only excludes working capital generated (I deduct working capital consumed). Despite appearing to be inconsistent, this makes sense because in order to meet my definition of sustainability the MLP should generate enough capital to cover normal working capital needs. On the other hand, cash generated by the MLP through the liquidation or reduction of working capital is not a sustainable source and I therefore ignore it. Over reasonably lengthy measurement periods, working capital generated tends to be offset by needs to invest in working capital.
Coverage ratios continue to be below 1.0 as indicated in Table 4 below:
As seen in Table 3, the large investment in working capital accounts for the bulk of the difference between coverage based on reported vs. sustainable DCF shown in Table 4. The ratios will converge in future periods if further investments in working capital are not required.
I find it helpful to look at a simplified cash flow statement by netting certain items (e.g., acquisitions against dispositions) and by separating cash generation from cash consumption. Here is what I see for ETP:
Simplified Sources and Uses of Funds 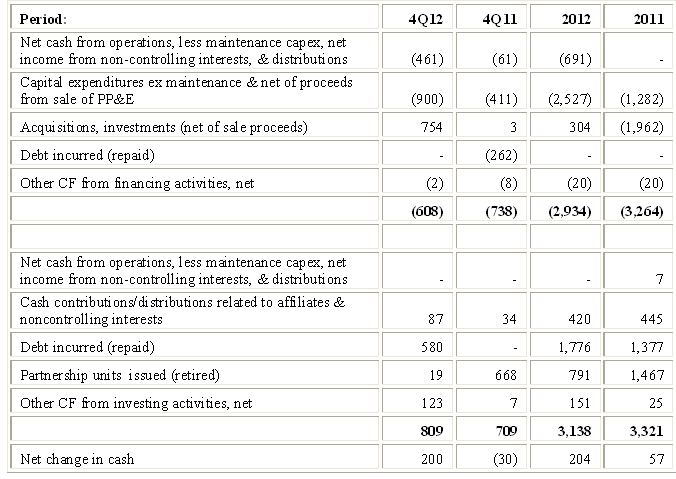
Net cash from operations, less maintenance capital expenditures, less net income from non-controlling interests fell short of covering distributions by $691 million in 2012. However, some distributions from unconsolidated affiliates appear in the cash flow statement as cash from affiliates and non-controlling interests (e.g., RGP’s contribution to the Lone Star JV totaled $320 million in 2012). Those items totaled $420 million in 2012 and if I reclassify them to cash from operations the shortfall is reduced to $271 million. Still, in 2012 ETP funded a portion of its distributions (I estimate ~17%) by issuing equity, debt and/or using proceeds from asset dispositions.
However, it is difficult to draw conclusions due to all the “noise” in the 2012 financials and the fact that large acquisitions were made during 2012 but their results are included on a partial year basis (from the date they were acquired). A pro forma analysis of what the 2012 income statement would have looked like had the Sunoco and Holdco transactions occurred on January 1, 2012 is provided below: 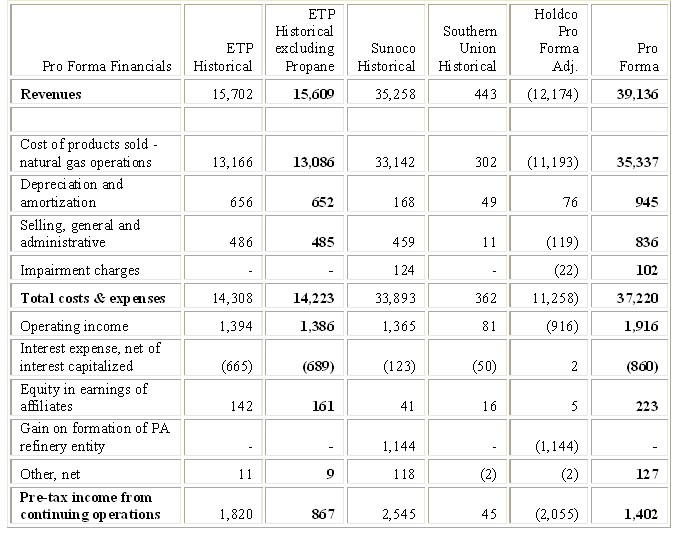
The sale of the retail propane business to APU occurred on January 12, 2012. Therefore the relevant columns to compare in Table 6 are the 3rd (ETP Historical excluding Propane) and the last (Pro Forma). On a pro forma basis pre-tax income would have increased by ~62% while the number of units outstanding increased by ~40%.
ETP’s current yield is at the high end of the MLP universe. A comparison to some of the MLPs I follow is provided in Table 7 below: 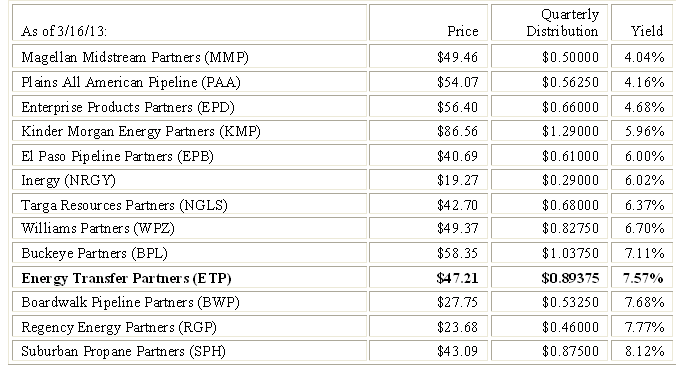
My concerns regarding ETP revolve around: 1) lack if distribution growth and the inadequate distribution coverage; 2) the structural complexities; 3) the high burden created by the IDRs (notwithstanding temporary waivers and reductions by ETE): 4) the challenges of integrating the operations acquired and selling portions deemed non-core (e.g., sale of Southern Union’s utility operations to Laclede Group); 5) the decision to retain the Sunoco retail operation despite a lack of fit and no announcement as to a solution that would eliminate the tax inefficiencies; and 6) the need to face additional, significant non-arms length transactions as management seeks to simplify the organization, a process it acknowledges may take two years. An example of the latter is Holdco’s sale of Southern Union Gas Services, Ltd. (SUGS), to RGP for $1.5 billion. Management previously stated it is contemplating folding RGP into ETP, which would be another complex related-party transaction. These concerns previously led me to reduce my ETP position. I have not reduced it further and have retained my ETE position.
- English (UK)
- English (India)
- English (Canada)
- English (Australia)
- English (South Africa)
- English (Philippines)
- English (Nigeria)
- Deutsch
- Español (España)
- Español (México)
- Français
- Italiano
- Nederlands
- Português (Portugal)
- Polski
- Português (Brasil)
- Русский
- Türkçe
- العربية
- Ελληνικά
- Svenska
- Suomi
- עברית
- 日本語
- 한국어
- 简体中文
- 繁體中文
- Bahasa Indonesia
- Bahasa Melayu
- ไทย
- Tiếng Việt
- हिंदी
A Closer Look: Energy Transfer Partners' Distributable Cash Flow
Published 03/19/2013, 04:06 AM
Updated 07/09/2023, 06:31 AM
A Closer Look: Energy Transfer Partners' Distributable Cash Flow
3rd party Ad. Not an offer or recommendation by Investing.com. See disclosure here or
remove ads
.
Latest comments
Install Our App
Risk Disclosure: Trading in financial instruments and/or cryptocurrencies involves high risks including the risk of losing some, or all, of your investment amount, and may not be suitable for all investors. Prices of cryptocurrencies are extremely volatile and may be affected by external factors such as financial, regulatory or political events. Trading on margin increases the financial risks.
Before deciding to trade in financial instrument or cryptocurrencies you should be fully informed of the risks and costs associated with trading the financial markets, carefully consider your investment objectives, level of experience, and risk appetite, and seek professional advice where needed.
Fusion Media would like to remind you that the data contained in this website is not necessarily real-time nor accurate. The data and prices on the website are not necessarily provided by any market or exchange, but may be provided by market makers, and so prices may not be accurate and may differ from the actual price at any given market, meaning prices are indicative and not appropriate for trading purposes. Fusion Media and any provider of the data contained in this website will not accept liability for any loss or damage as a result of your trading, or your reliance on the information contained within this website.
It is prohibited to use, store, reproduce, display, modify, transmit or distribute the data contained in this website without the explicit prior written permission of Fusion Media and/or the data provider. All intellectual property rights are reserved by the providers and/or the exchange providing the data contained in this website.
Fusion Media may be compensated by the advertisers that appear on the website, based on your interaction with the advertisements or advertisers.
© 2007-2024 - Fusion Media Limited. All Rights Reserved.
