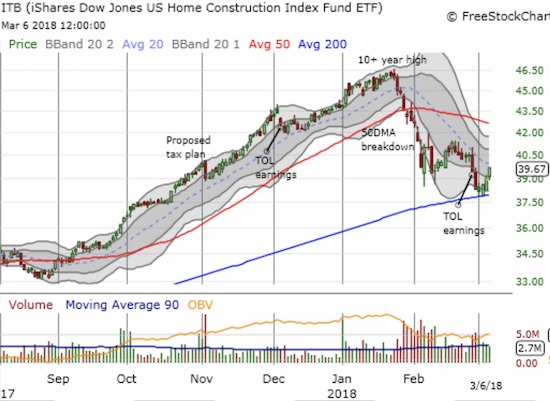
The seasonal trade on home builders for 2017/2018 showed its first sign of trouble when the iShares US Home Construction (NYSE:ITB) fell sharply off its 10+ year high in January on the same day the S&P 500 (via SPDR S&P 500 (NYSE:SPY)) set a new (and its last) all-time high. Almost two weeks later, in early February, the under-performance widened and became painfully clear as ITB confirmed a breakdown below its 50-day moving average (DMA). Now a month later, ITB has valiantly pulled off a successful test of support at its 200-day moving average (DMA). Still, with ITB down 8.8% year-to-date versus the S&P 500’s YTD gain of 2.0% as the Spring selling season gets underway, I have concluded the seasonal trade on home builders is all but over for this season.

The iShares US Home Construction ETF (ITB) pulled off a picture-perfect bounce off 200DMA support. Confirmation of support will likely only come with a close above 50DMA resistance.
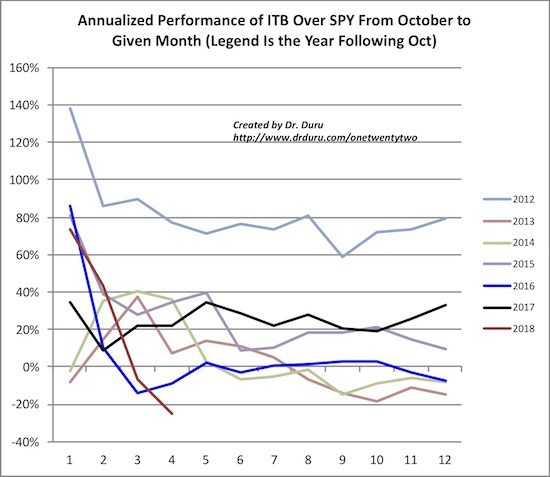
In December, 2015, I described the poor start to the seasonal trade. Sure enough, the trade for that 2015/2016 season turned into the worst since the 2008/2009 season. I was able to anticipate the poor performance because of the typical pattern of the trade: a strong jump out the gate for the first few months after the season kicks off in November and then a gradual, often choppy, decline or drift into the summer in terms of annualized performance. By the Fall, the seasonal trade loses almost all its gas. ITB’s performance peaks between March and April and its performance relative to the S&P 500 peaks around the same time. Based on the current performance, this season’s trade will perform even worse than the 2015/2016 season but still not quite as poorly as the 2008/2009 season. Through February (the fourth month of the trade), ITB has underperformed the S&P 500 (SPY) by 25.4 percentage points.
In the charts below, I show 2012 to 2018 for clarity. Readers can refer to the last seasonal analysis for the years 2007 to 2011. The x-axis is an index that counts the months in the seasonal trade which starts in November, month number 1. The y-axis is the difference in annualized performance in percentages between ITB and the S&P 500 (SPY). Each colored line is a different season. For example, the line for 2012 measures the November, 2011 to October, 2012 season (or 2011/2012).

The iShares US Home Construction ETF (ITB) is severely underperforming the S&P 500 (SPY) for the season.
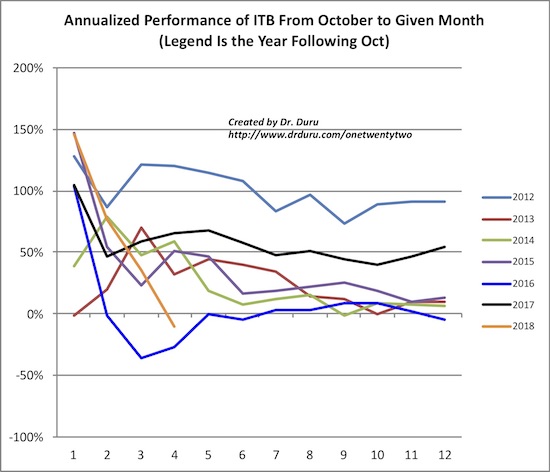
For perspective, I post below the seasonal performance of ITB on its own. Note that three other seasons have performed worse than 2017/2018 at this point in the cycle: 2007/2008, 2008/2009, and 2015/2016. This is awful company! With performance typically peaking in the next 30 to 60 days, ITB is not likely to do much better for most of the rest of the year.

The iShares US Home Construction ETF (ITB) performed worse at this point in the cycle in 2016.
The busted seasonal trade hangs my last tranche of related positions out to dry. I will ride out what is left of the bounce from 200DMA support, but I will officially bring most of the trades to an end if (when?) ITB confirms a 200DMA breakdown. This bust also coincides with a February Housing Market Review that flagged some warning signs, so I am eagerly awaiting March’s round of data…!
For reference the following home builders bounced off 200DMA support alongside ITB: D.R. Horton (NYSE:DHI), Lennar (NYSE:LEN), Pulte Home (NYSE:PHM), Toll Brothers (NYSE:TOL), and Tri Pointe Group (NYSE:TPH),
Be careful out there!
Full disclosure: long ITB calls, long SPY call spread, long TOL calls, long LEN calls
