In the first few months of 2016, strong performance in Gold and Silver resulted in a sharp rally in precious metal stocks. Several oversold gold and silver mining companies had strong performance over the past few months. Similar bullish themes can take place in the basic materials and energy complex. Some of the commodities in the industrial metals and energy group are in the process of forming major long-term bottoms. The same bullish chart set-ups can also be seen in the equities of basic materials and energy companies.
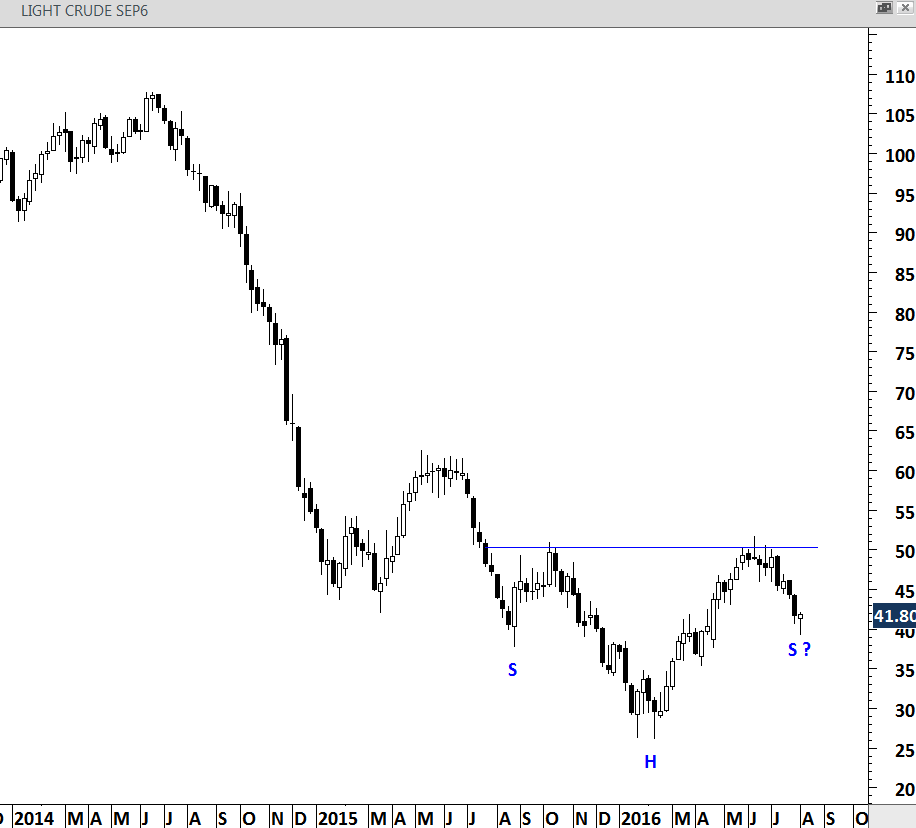
WTI Light Crude is possibly forming a H&S bottom with the neckline standing at $50 levels. This chart is still at the early stages of a H&S formation. A few more weeks of strength will complete the right shoulder of a year-long base formation.
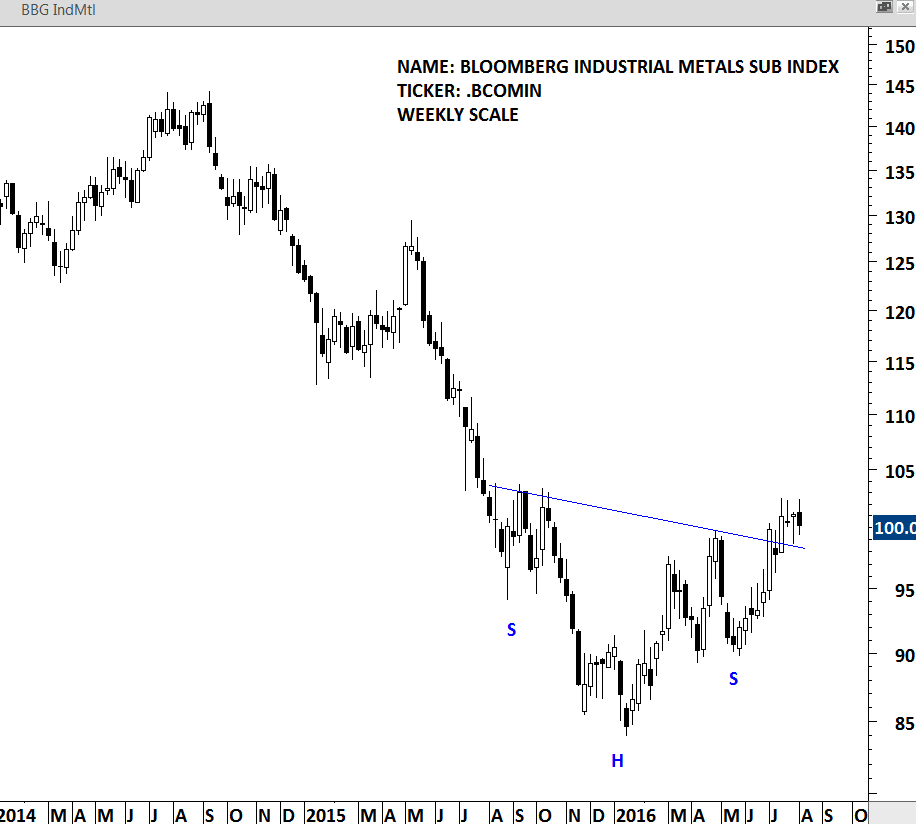
Formerly known as Dow Jones-UBS Industrial Metals Subindex Total Return (DJUBINTR), the index is a commodity group subindex of the Bloomberg Industrial Metals. The index is composed of longer-dated futures contracts on sluminum, copper, nickel and zinc. It reflects the return on fully collateralized futures positions and is quoted in USD. This chart has possibly completed a H&S bottom and currently consolidating above the neckline.
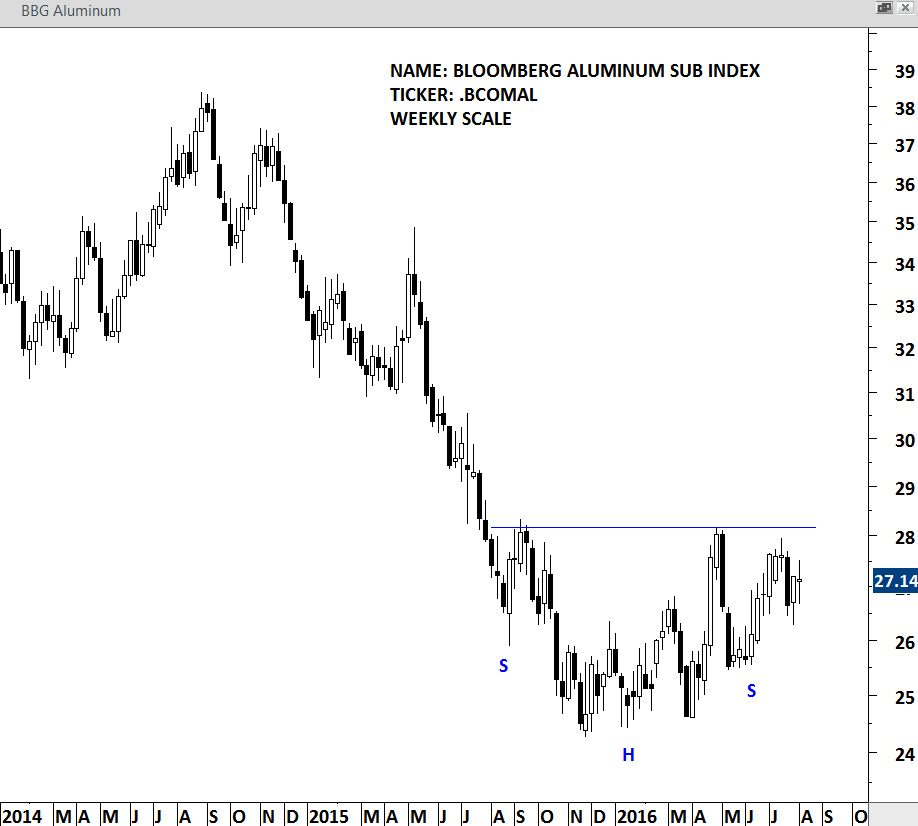
Formerly known as Dow Jones-UBS Aluminum Subindex Total Return (DJUBALTR), the index is a single commodity subindex of the Bloomberg CI composed of futures contracts on Aluminum. It reflects the return of underlying commodity futures price movements only and is quoted in USD. The neckline of the year-long base formation stands at 28.20 levels.
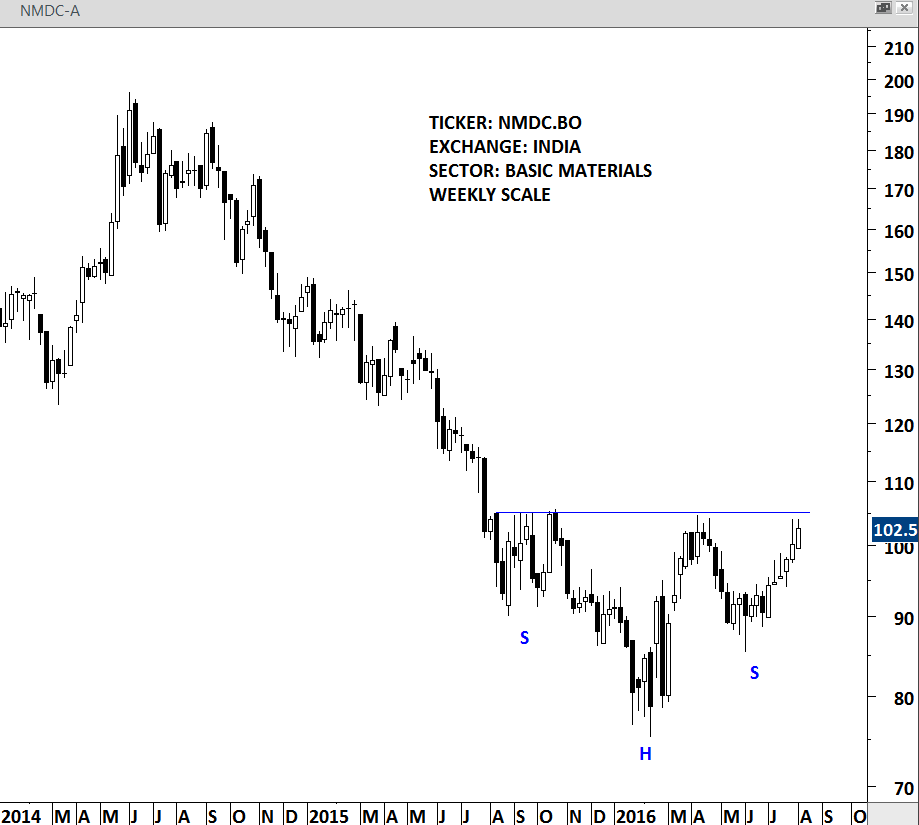
NMDC Limited (NS:NMDC) is an India-based company engaged in the mining of iron ore. The Company's business segments include iron ore and other minerals and services. The Company is also engaged in the exploration of various minerals, including copper, rock phosphate, lime stone, dolomite, gypsum, bentonite, magnesite, diamond, tin, tungsten, graphite and beach sands. A perfect horizontal resistance (neckline) stands at 105 levels. Breakout above this level will complete a year-long base formation.
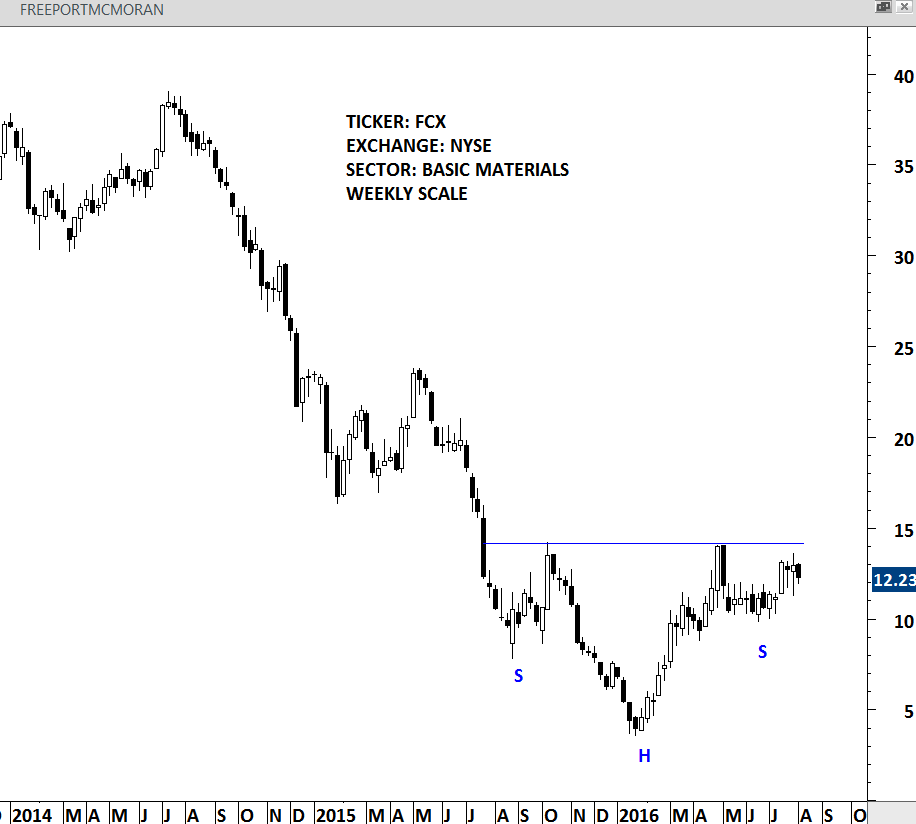
Freeport-McMoRan Inc. (NYSE:FCX) is a natural resource company with a portfolio of mineral assets, and oil and natural gas resources. The Company's segments include the Morenci, Cerro Verde, Grasberg and Tenke Fungurume copper mines, the Rod & Refining operations and the U.S. Oil & Gas Operations. It has organized its operations into five primary divisions: North America copper mines, South America mining, Indonesia mining, Africa mining and Molybdenum mines. This is another perfect example of a year-long H&S bottom with the neckline standing at 14.20 levels. Breakout above 14.20 will be bullish and possibly target 25 levels.
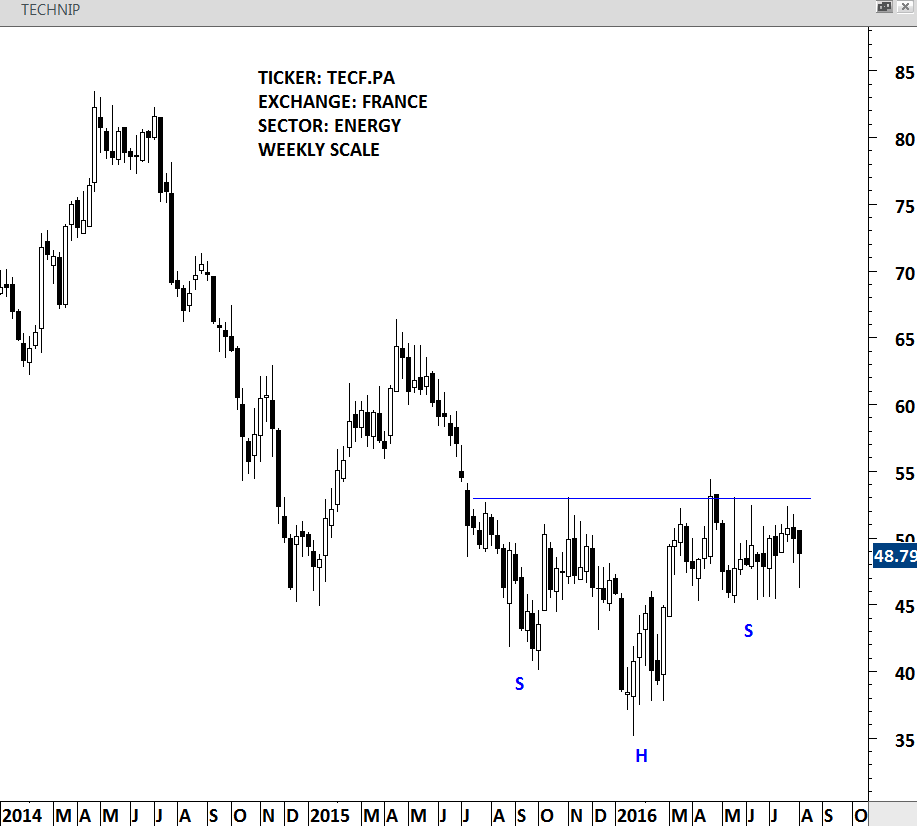
Technip SA (PA:TECF) SA is engaged in project management, engineering and construction for the energy sector. The Company operates through two segments: Subsea, Onshore/Offshore and Corporate. This stock is listed in France. Over the past year, 53 levels acted as strong resistance. The stock might be completing a year-long base.
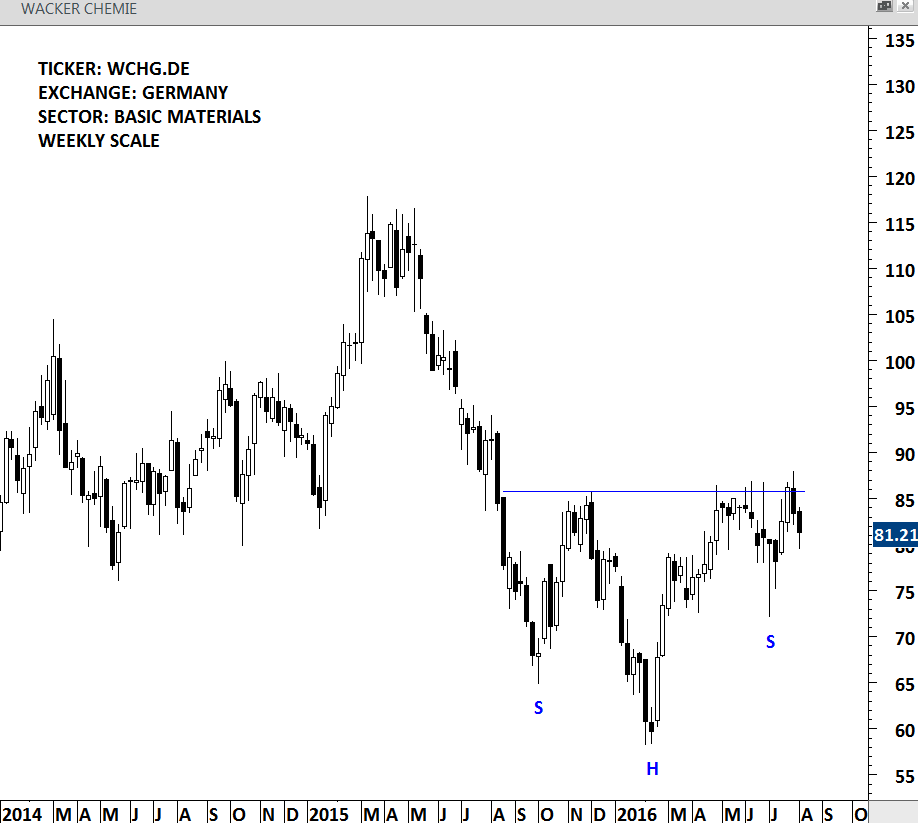
Wacker Chemie AG (DE:WCHG) is a Germany-based company engaged in chemical industry. The Company operates through four business segments: WACKER SILICONES, which produces silicone products, ranging from silanes through silicone fluids, emulsions, elastomers, sealants and resins to pyrogenic silicas; WACKER POLYMERS, which offers a range of polymeric binders and additives; WACKER POLYSILICON, which provides polysilicon, and WACKER BIOSOLUTIONS, which is the life science division of the Company, offers solutions and products for the food, pharmaceutical and agrochemical industries.
While this base formation does not have the perfect symmetry between the left and right shoulders, it is clear from the chart that the horizontal resistance at 86 levels will be critical in the coming weeks. Breakout above 86 will be bullish.
