
AT40 = 17.3% of stocks are trading above their respective 40-day moving averages (DMAs) – 10th day of oversold period following 4-day oversold period
AT200 = 29.5% of stocks are trading above their respective 200DMAs
VIX = 23.4
Short-term Trading Call: bullish
Commentary
The small bullish divergence to start the week received follow-through in the form of a big rally day in the stock market. AT40 (T2108), the percentage of stocks trading above their respective 40-day moving averages (DMAs), jumped from 11.9% to 17.3%. Suddenly, it looks possible for the stock market to bring an end this week to this extremely extended oversold period (AT40 above 20%). AT200 (T2107), the percentage of stocks trading above their respective 200DMAs, came to life by hopping from 25.4% to 29.5%. AT200 even slightly broke through its steep downtrend.
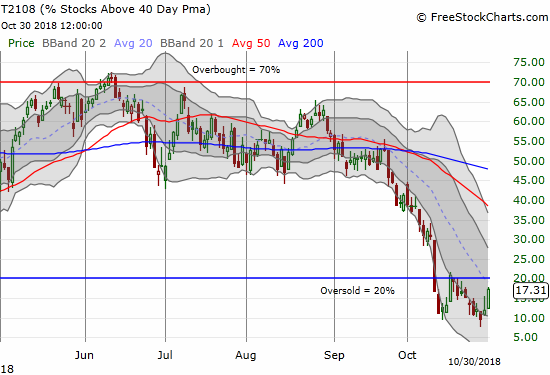
AT40 (T2108) surged from the lows to the oversold threshold. 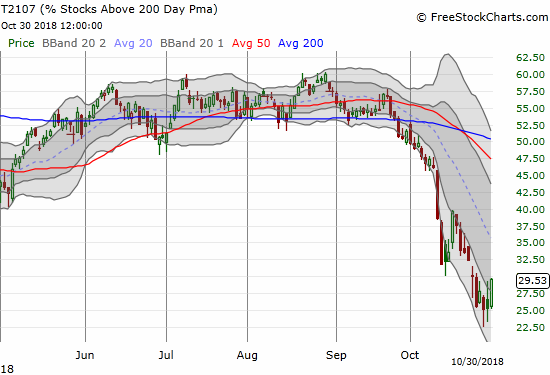
AT200 (T2107) bounced enough to sneak a peak above its relentless October downtrend.
So far, the S&P 500 (NYSE:SPY) is down 4.5% for this 10-day old oversold period. The index is down 3.7% from the start of the first oversold period which is only separated from the current period by one trading day. If the oversold period had ended today, the S&P 500’s performance would have been in-line with historic 14-day long oversold periods and under-performed historic 10-day oversold periods. In both cases projections are for less weakness.
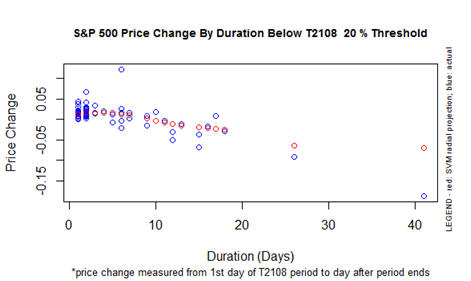
The performance of the S&P 500 for a given oversold duration (T2108 below 20%).
In other words, there is a decent case to be made that the breakout from this oversold period will come with another big rally day for the S&P 500. It will need to be a big move to break out of the current steep downward trading channel formed by the lower Bollinger® Bands (BBs).
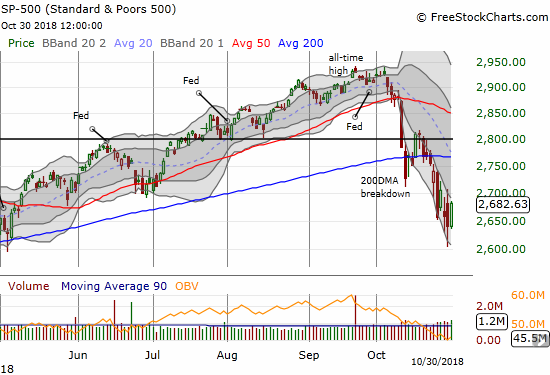
The S&P 500 (SPY) rallied for a 1.6% gain that perfectly matched the previous day’s open and close lower.
The NASDAQ gained the same percentage as the S&P 500 but its range of motion was not nearly enough to nullify the previous day’s fade and selling. The Invesco QQQ Trust (NASDAQ:QQQ) gained 1.7% but also failed to nullify the previous day’s pressure.
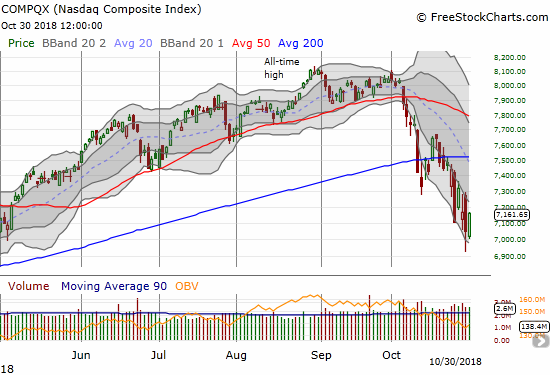
The NASDAQ rallied for a 1.6% gain but still sits well within the downward trading channel formed by the lower Bollinger Bands (BBs). 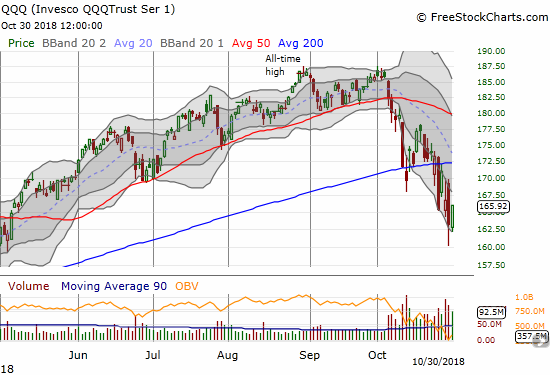
The Invesco QQQ Trust (QQQ) rallied 1.7% but still sits within a steep downward trading channel.
The volatility index, the VIX, only fell 5.5% and closed at 23.4. It is still at elevated levels (above 20) so the stock market remains very vulnerable to wide swings and sharp selling, but at least the intraday high did not reach the recent highs.
The IWM rallied for a 2.1% gain. Unlike the other major indices, IWM managed to tap the upper bound of its downward trading channel. IWM hugged this line in the selling that led to the current levels. Follow-through buying would represent a very important breakout.
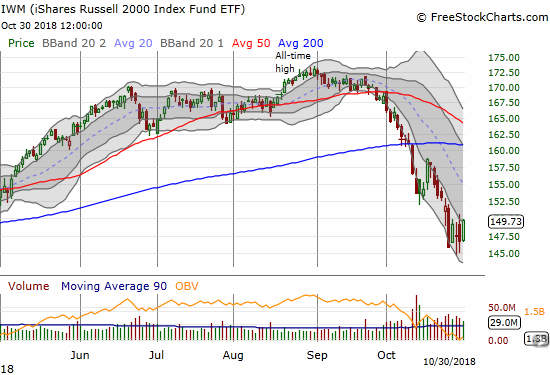
The IWM is making another attempt to break out from its downward trading channel former by its lower Bollinger Bands.
Although I did not get the volatility spike I wanted to trigger more aggressiveness, I still treated the rally as a validation of the bullish signs from the previous day. I focused on my shopping list even as I took my profits on my latest tranche of SPY call options (expiring Friday). I loaded up on CSX Corporation (NASDAQ:CSX) calls, a calendar call spread on Intel (NASDAQ:INTC), and of course I implemented my Facebook (NASDAQ:FB) pre-earnings trade (twice!). I also decided to get aggressive with small caps given the abundance of beaten up small caps I saw with big gains on the day. I started accumulating call options on IWM expiring in 2 1/2 weeks. I capped off my hedges with a put spread on Boeing (NYSE:BA) which rallied right to its 200DMA and an obligatory put option on Caterpillar (NYSE:CAT). From here, I can stay 100% focused on the bullish buying opportunities…while of course keeping in my peripheral vision the on-going (technical) market risks that I have covered in previous Above the 40 posts.
CHART REVIEWS
Equifax Inc. (NYSE:EFX)
I lost track of EFX in the market sell-off. This is a stock I would have shorted upon the FIRST break of its 200DMA. The second 200DMA breakdown would have been my confirmation. Instead, I can only watch as I see the bearish weight reassert itself on EFX. At its post-earnings intraday low, EFX traded right at the close that marks its post data breach low.
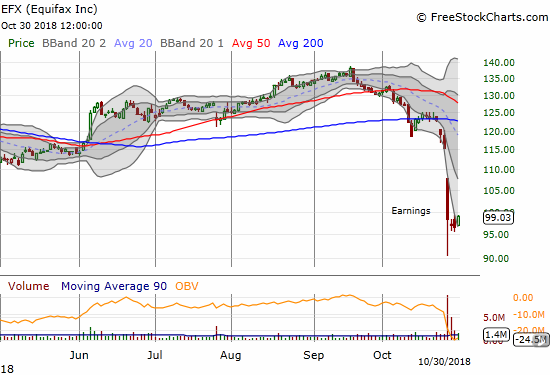
Equifax Inc. (EFX) confirmed a 200Dma breakdown ahead of earnings. The stock is now trying to form a bottoming pattern.
General Electric (NYSE:GE)
Both the fundamentals and the technicals failed to identify a sustainable bottom in GE. Now I just throw up my hands. Times like these remind me of the loss-limiting benefits of playing options instead of shares for such a high-risk play.
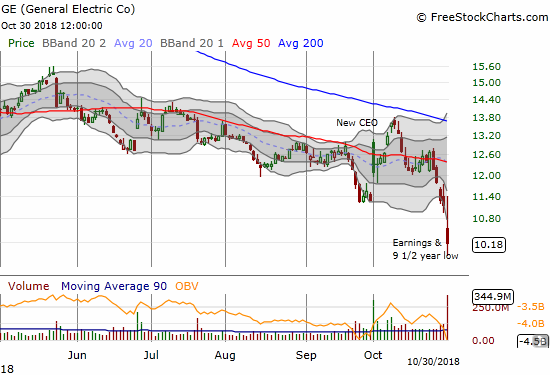
Back to the regularly scheduled disaster that is General Electric Company (NYSE:GE). Its 8.8% post-earnings loss left the stock languishing at a 9 1/2 year low….prices last seen after the depths of the financial crisis.
International Business Machines (NYSE:IBM)
IBM is clearly desperate to arrest its stubbornly persistent downward momentum. The company offered a massive premium to buy Red Hat (NYSE:RHT) in a cash deal valuing RHT at $190/share (and yes, I did happen to get back into the stock ahead of this news. I closed out the position of course). IBM’s stock understandably dipped Monday on the news. However, today’s resumption of selling surprised me. IBM lost 3.5% and finally broke down below its 2016 low. IBM last saw these prices way back in July, 2009! If the mega-deal for RHT cannot rejuvenate the stock, what can?
In the meantime, RHT is still trading at a discount to the deal’s value. On Monday, RHT fell as low as $166. Today it closed up slightly to $170. Options players are just as skeptical. The June 2019 $180 call option sells for around $4.50. I would have expected it to trade at least at $8.00. I want to buy RHT call options, and now I am wondering whether there is a pairs trade opportunity with IBM…I just do not know whether the paired position should be long or short!
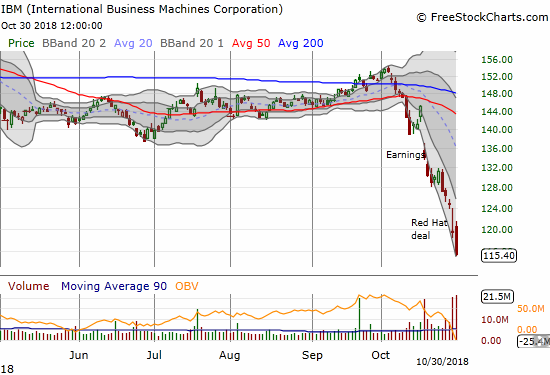
International Business Machines (IBM) dropped to prices last seen July, 2009. The 3.5% loss extended its post-earnings malaise and spoke volumes about investor interest in the deal for Red Hat (RHT).
Intel Corporation (NASDAQ:INTC)
I do not like to chase, but I also do not want INTC to get away from me coming off a good response to it earnings report. On Monday, INTC almost closed its post-earnings gap, and I failed to get my between earnings trade started. Today, the stock suddenly soared 5.2%. At a 4% gain on the day, I decided to jump in with a “starter” position using a Nov/Jan $48 calendar spread. I am targeting 200DMA resistance to hold for the next two weeks on INTC. If INTC dips back to or around its 50DMA, I will start loading up on calls straight up.
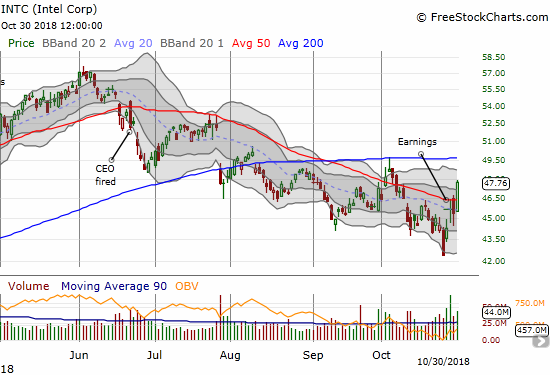
Suddenly Intel (INTC) is in a run-up. The stock surged 5.2% in a move that smashed through 50DMA resistance. Next stop should be another tussle with 200DMA resistance.
Logitech International SA (NASDAQ:LOGI)
I periodically check in on LOGI for a new entrypoint for buying. The stock’s post-earnings low wiped out all the stock’s gain for 2018. I like accumulating shares after the stock prints a post-earnings closing high which should, hopefully, signify the return of buyers to the stock.
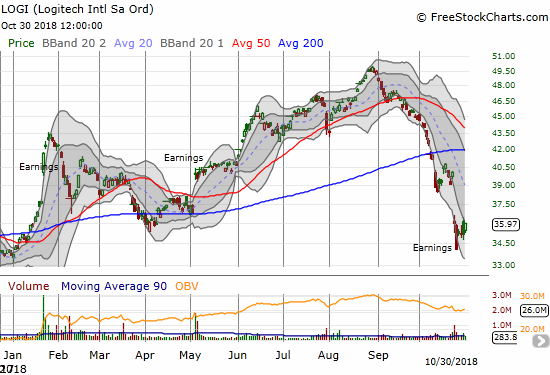
Logitech (LOGI) almost gave up all its gains for 2018 after a post-earnings plunge.
Netflix (NASDAQ:NFLX)
NFLX demonstrated yet more relative weakness. The stock gapped down at the open and had to claw its way back to a mere 0.3% gain. The intraday low matched with the intraday lows from April.
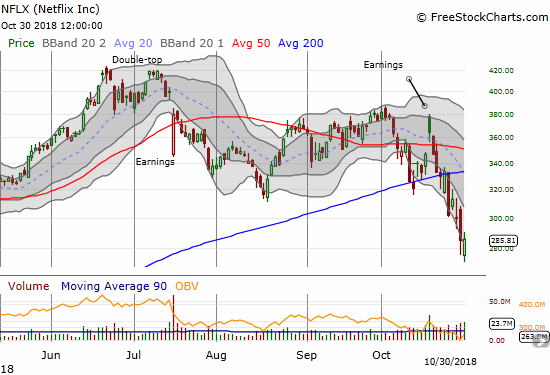
The opening gap down for Netflix (NFLX) was so steep that the subsequent rally could only close NFLX close to flat for the day.
Walmart (NYSE:WMT)
WMT is one of the last stocks I could imagine going (near) parabolic. Yet, here it is surging for a 2.6% gain and closing well above its upper Bollinger Band after announcing a package of new technologies and services in advance of the holiday shopping season. WMT has taken off in the middle of a vicious market sell-off. The stock bounced nearly straight off its 50DMA support in an impressive display of relative strength as the rest of the stock market just kept sinking. With the stock finally printing a new post-earnings high, WMT is positioned to challenge its all-time high. I imagine the stock will need a “rest” soon to fuel up for the next charge higher.
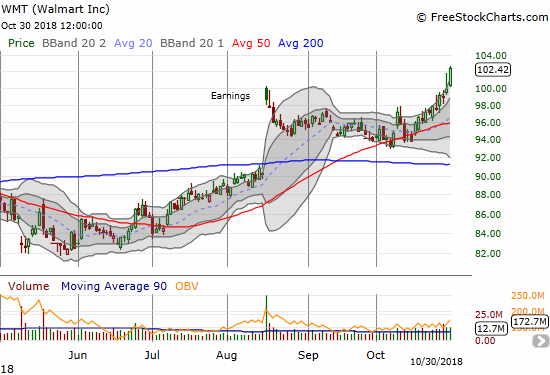
Suddenly the momentum from earnings is back for Walmart (WMT). The stock held 50DMA support on its way to a near parabolic run-up to an 8-month high.