Get 40% Off
🚨 Volatile Markets? Find Hidden Gems for Serious OutperformanceFind Stocks Now

8 Monster Stock Market Predictions For The Week Of October 12

Published 10/11/2020, 01:14 AM
Updated 09/20/2023, 06:34 AM

It will be a busy week for stocks with plenty of economic news. Still, the focus will remain on the potential for an economic stimulus that should help boost the economy. As long as the Democrats continue to entertain President Trump’s offers to do a stimulus, the market will continue to rise on hopes of another 2 trillion dollar relief bill. However, I feel that is unlikely that the Senate would pass such a measure before the election and with the beginning of a confirmation hearing for the Supreme Court nominee.

Additionally, there seems to be a belief that Joe Biden will easily win the election. Also, many believe a blue wave will sweep across the country. I think the chances of a blue wave are slim, and undersampling has given the impression the former VP has a wide lead. My research suggests otherwise. But, this belief will help to elevate the market. – Biden’s Lead Over Trump May Be Much Smaller Than The Polls Suggest

We have typically seen on Monday mornings significant gaps higher for the S&P 500. I don’t think this Monday will be any different with the potential for the S&P 500 to rise to around two 3,500 and potentially as high as 3,560 over the next several sessions.
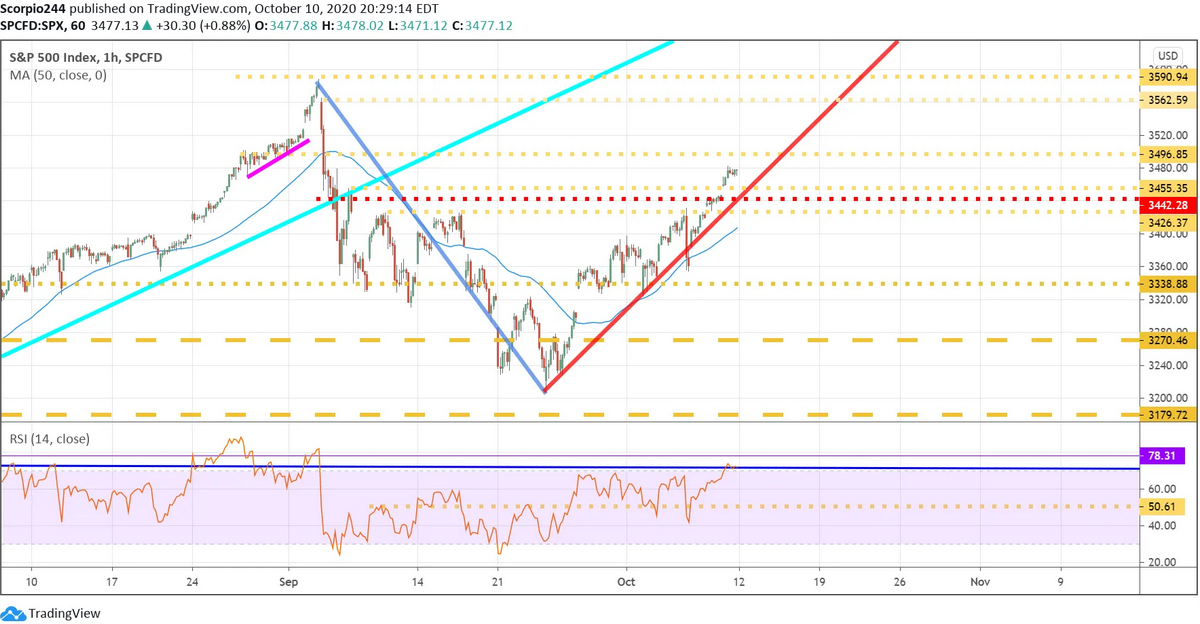
S&P 500 1 Hr Chart

Amazon

Amazon (NASDAQ:AMZN) could potentially push to around $3,340 this week, where it will meet a level of technical resistance.
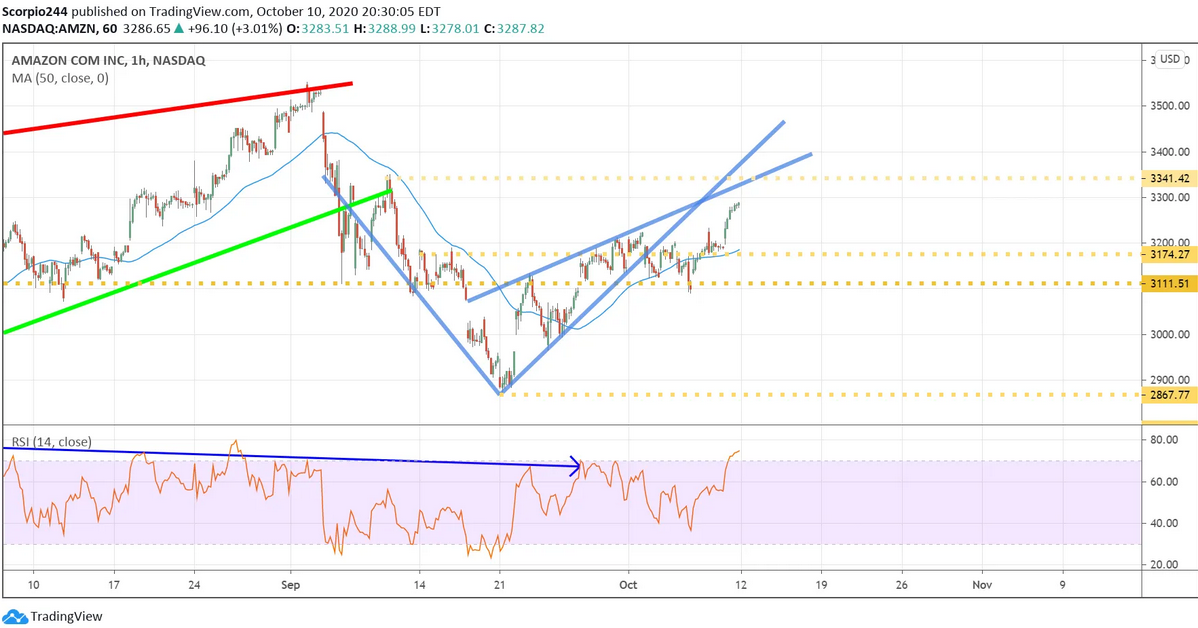
Amazon Inc 1 Hr Chart

AMD

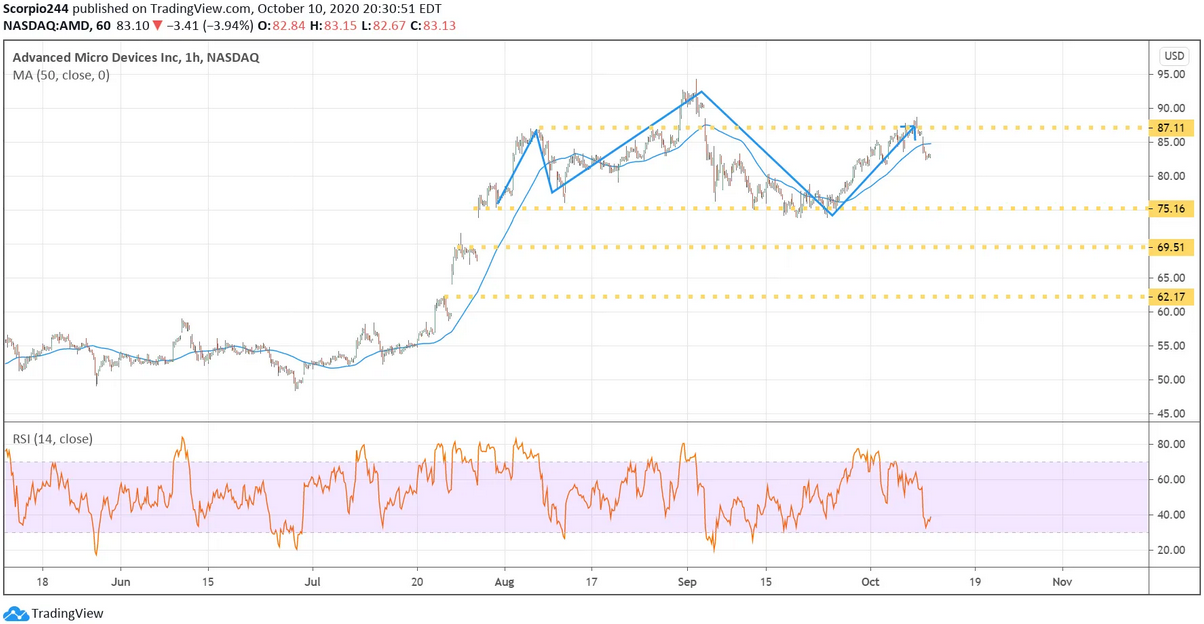
Advanced Micro Devices's (NASDAQ:AMD) potential acquisition of Xilinx (NASDAQ:XLNX) comes as a surprise, and it could be one reason why the stock continues to decline despite a rising market. It probably has a good chance to fall back to around $75.
3rd party Ad. Not an offer or recommendation by Investing.com. See disclosure here or remove ads .

AMD 1 Hr Chart

Facebook

Facebook (NASDAQ:FB) has the potential to break out and push higher towards its next level, $276
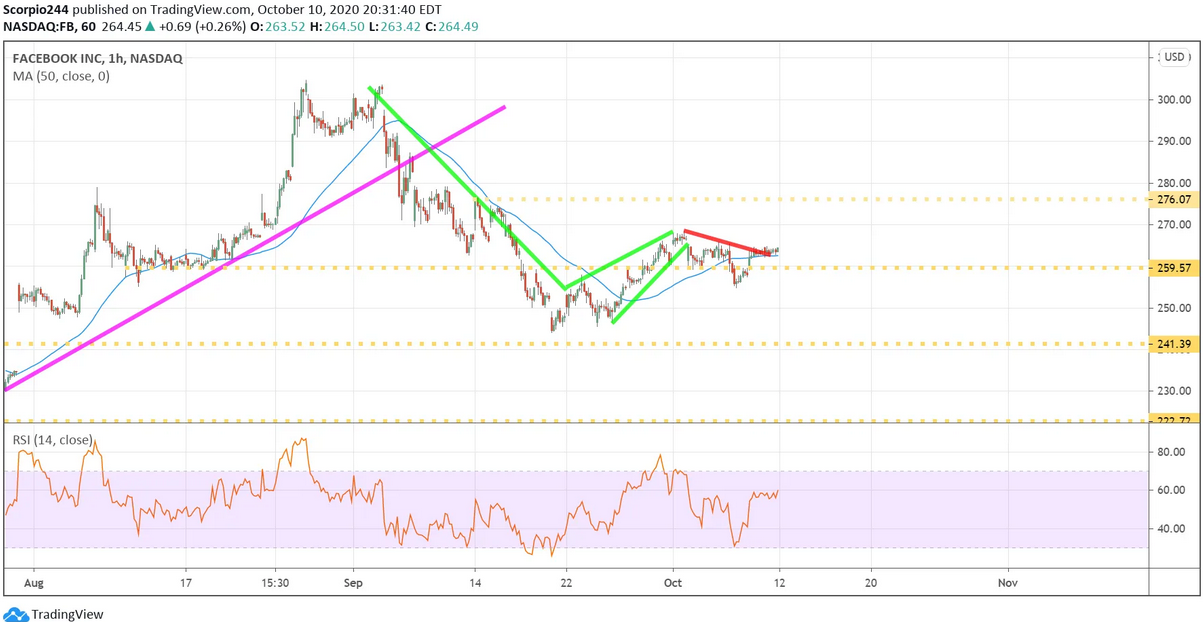
Facebook Inc Daily Chart

Intel

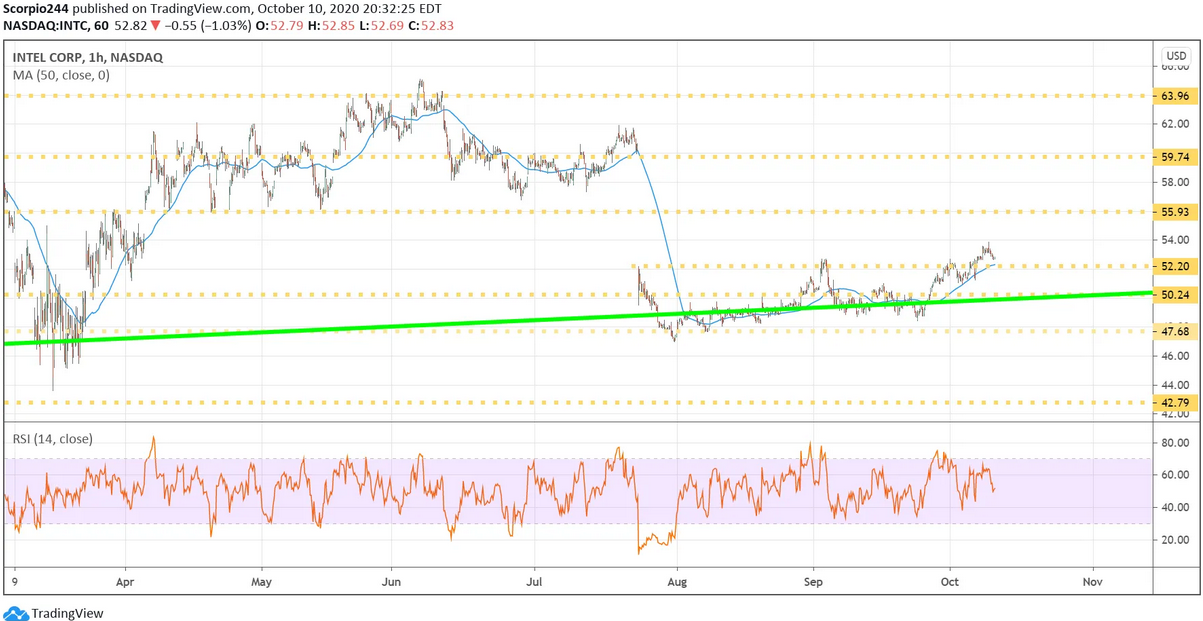
Inteln (NASDAQ:INTC) has been on a path to recovery, and I think this one is still continuing to head towards $56
Intel Corp 1 Hr Chart

Shopify

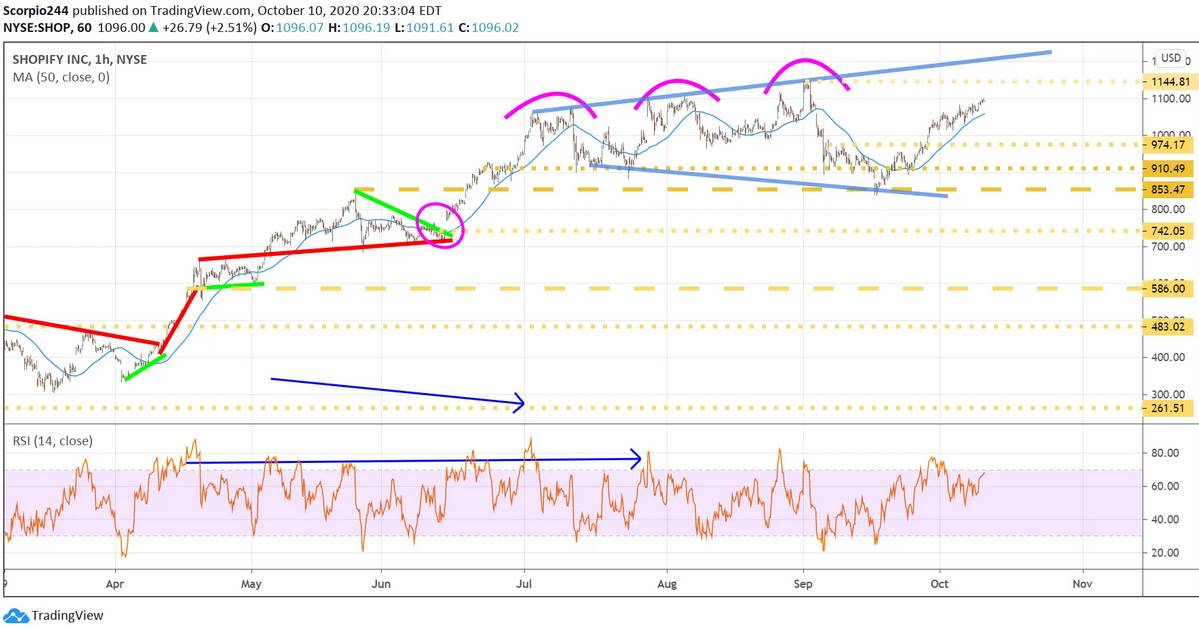
Shopify (NYSE:SHOP) managed to hold some essential support around $850 and is now likely heading back towards its all-time highs around $1150. Potentially, it could push even higher towards the top of the megaphone pattern at $1,200
Shopify Inc 1 Hr Chart

Tesla

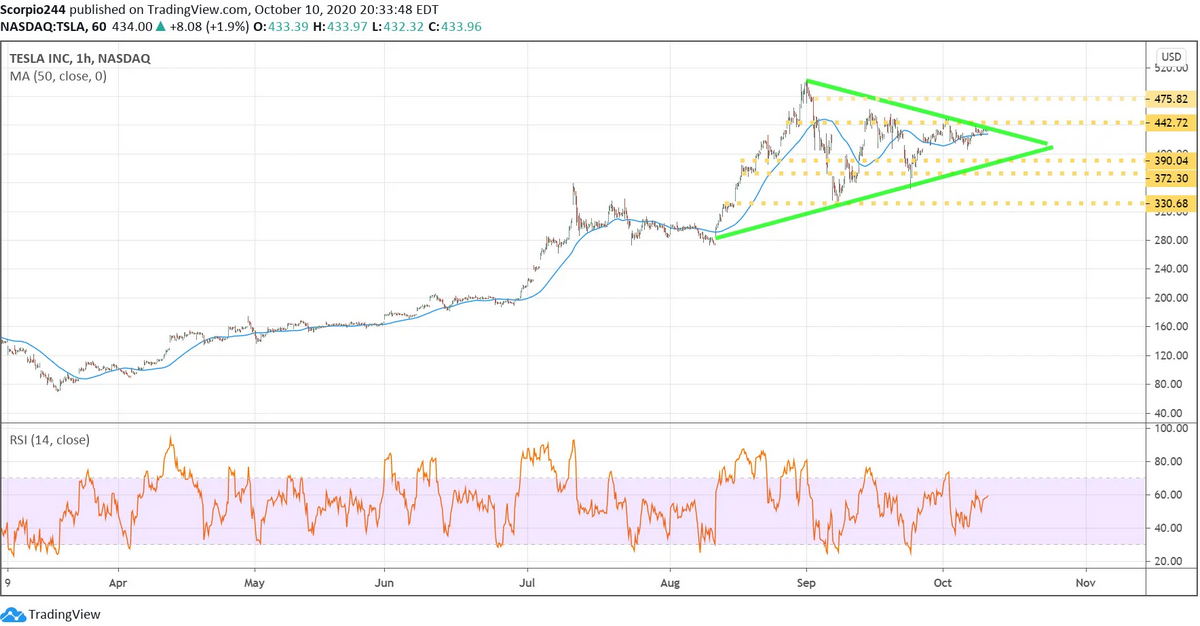
Tesla's (NASDAQ:TSLA) been trading sideways in a consolidation pattern, and a symmetrical triangle, a breakout above $442 likely sends the stock back towards $475
Tesla Inc 1 Hr Chart

Apple

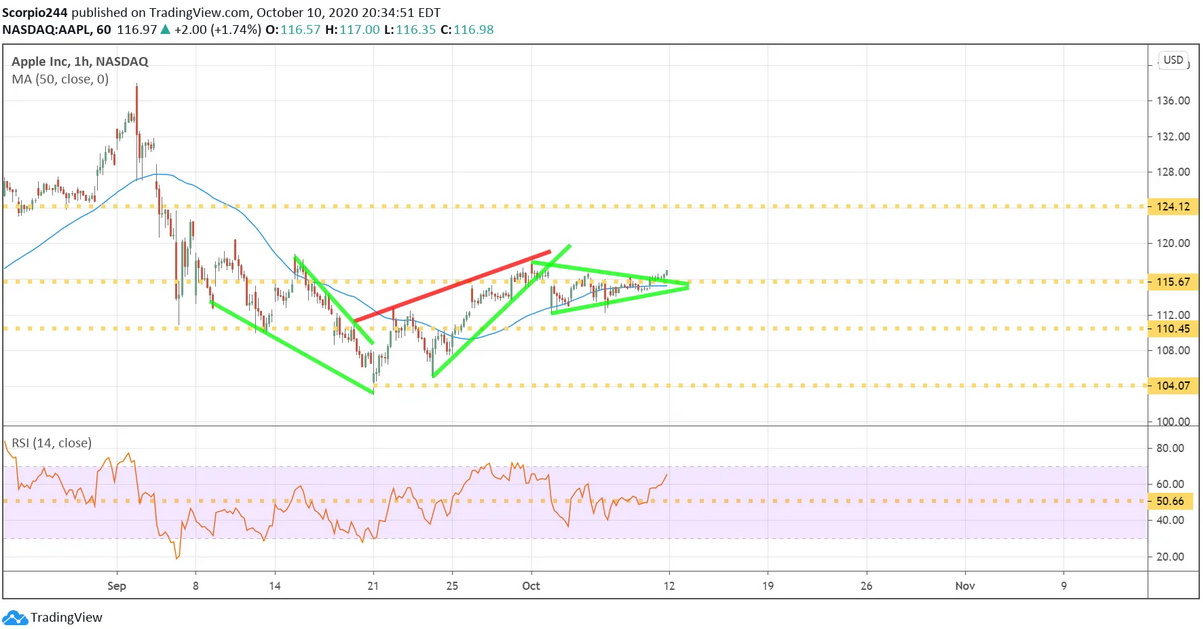
Finally, Apple(NASDAQ:AAPL) appears to be getting itself together with some big option bets placed last week, which suggests that the stock is breaking out right now, potentially heading back towards $125.
Apple Inc 1 Hr Chart

Original Post

Latest comments

Your work Michael is a stellar indicator, please continue the fine work.
Your election "research" says otherwise? What did your "research" consist of? Talking with a few friends/family members? Please fill us in
Risk Disclosure: Trading in financial instruments and/or cryptocurrencies involves high risks including the risk of losing some, or all, of your investment amount, and may not be suitable for all investors. Prices of cryptocurrencies are extremely volatile and may be affected by external factors such as financial, regulatory or political events. Trading on margin increases the financial risks.
Before deciding to trade in financial instrument or cryptocurrencies you should be fully informed of the risks and costs associated with trading the financial markets, carefully consider your investment objectives, level of experience, and risk appetite, and seek professional advice where needed.
Fusion Media would like to remind you that the data contained in this website is not necessarily real-time nor accurate. The data and prices on the website are not necessarily provided by any market or exchange, but may be provided by market makers, and so prices may not be accurate and may differ from the actual price at any given market, meaning prices are indicative and not appropriate for trading purposes. Fusion Media and any provider of the data contained in this website will not accept liability for any loss or damage as a result of your trading, or your reliance on the information contained within this website.
It is prohibited to use, store, reproduce, display, modify, transmit or distribute the data contained in this website without the explicit prior written permission of Fusion Media and/or the data provider. All intellectual property rights are reserved by the providers and/or the exchange providing the data contained in this website.
Fusion Media may be compensated by the advertisers that appear on the website, based on your interaction with the advertisements or advertisers.
© 2007-2024 - Fusion Media Limited. All Rights Reserved.