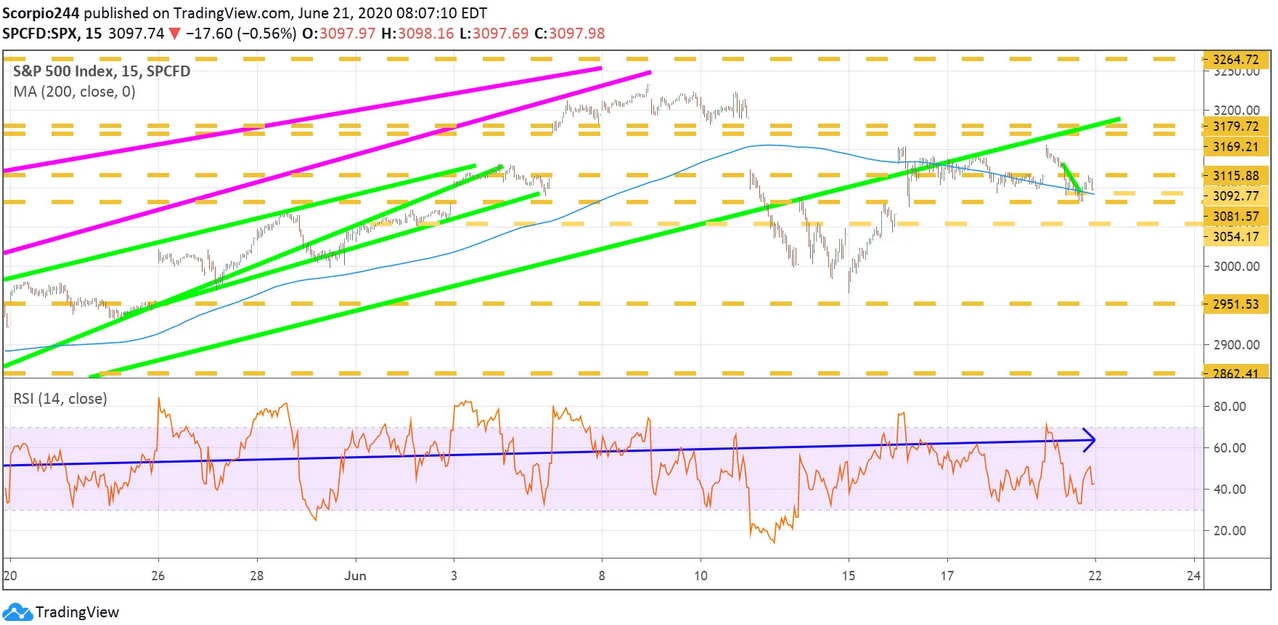
1. S&P 500
As I pointed out on Friday, the S&P 500 fell pretty hard from the day’s highs, and sold-off further in the after-hours session. It isn’t clear how much damage could be done should the S&P 500 fall, but at least for now, and this week the critical level to watch is 3,080 with a break of that level potentially trigger a further decline to around 3,050. Ultimately it seems reasonable to think the S&P 500 could retest the recent lows of about 2,960 from June 11. But at this point, that would seem to be potentially the worse. This is a short-term viewpoint, obviously, nor should it be interpreted that I’m looking for something more severe at this point. Could a drop to 2,960 likely happen this week? It could, but it seems it would be more likely to occur over the next two weeks.
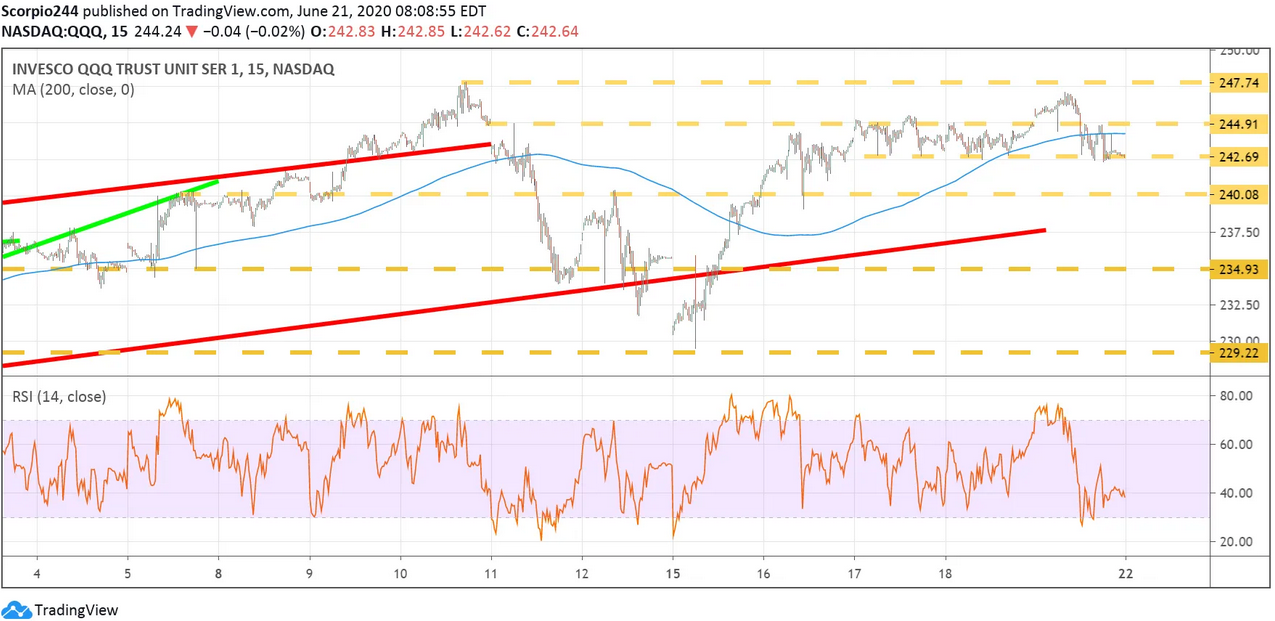
2. QQQ
The QQQs went out this week trading at $242, and that has been a significant level of technical support for the past week. Again, the Qs are in the same spot as the SPX, with the potential to fall to the recent lows at a level of around $230. Still, I’d imagine this would happen over the next two weeks.
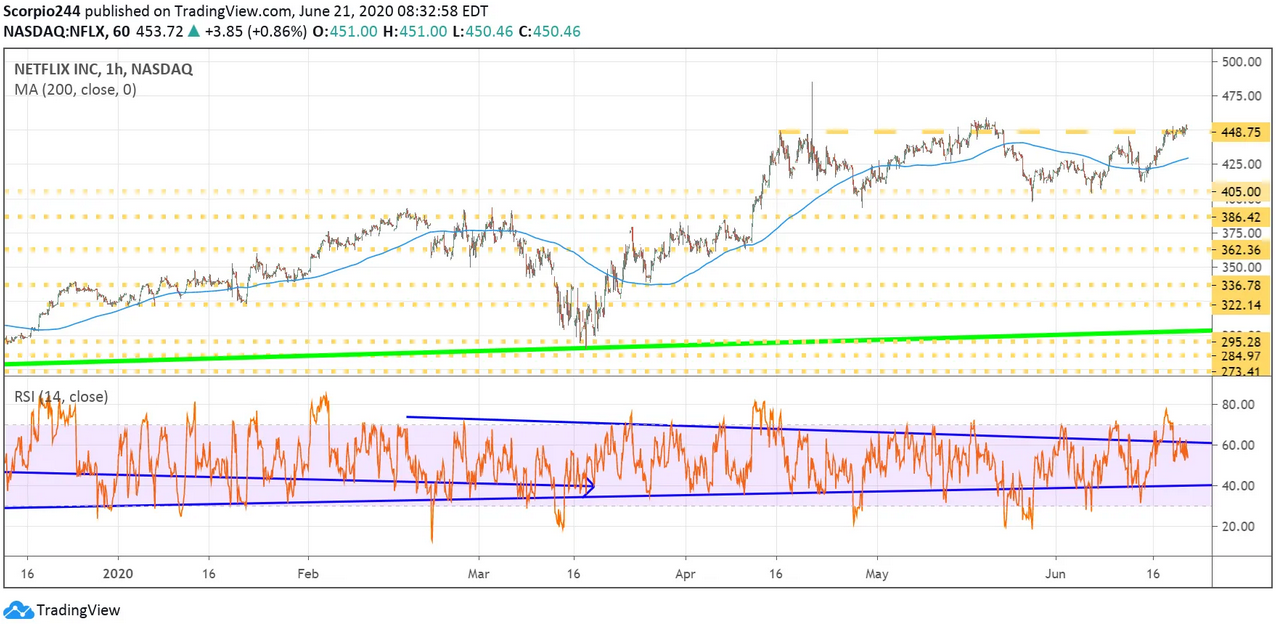
3. Netflix
Netflix (NASDAQ:NFLX) is one stock that needs to break out. It needs to get above $460 and soon. The pattern that is forming could be a head and shoulders, as I have noted before. To avoid this pattern, it will need to make a new high if it fails to create a new high, it is likely heading lower. It seems likely that they will report a strong quarter, but the question is what happens for the third quarter and what will that guidance look like. That is the big question, and how people should be thinking about from this point forward. How much growth was pulled forward, and what does that mean for subscriber growth in the future.
4. Alphabet
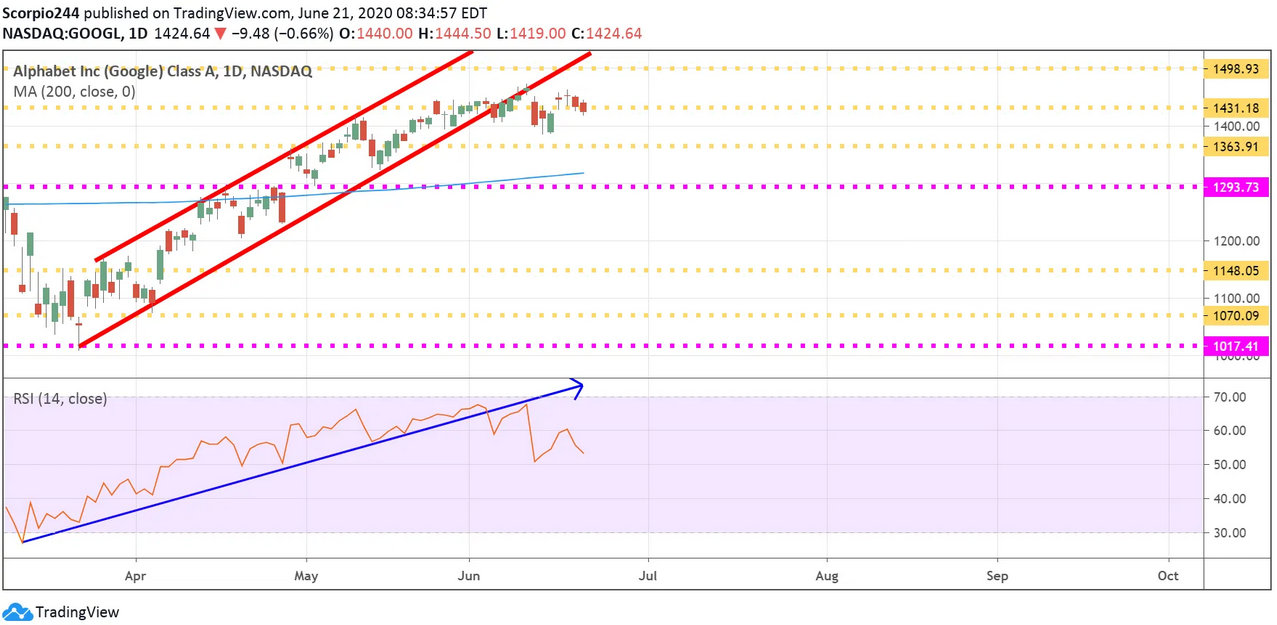
Alphabet (NASDAQ:GOOGL) fell out of the trading channel and has now topped out twice around $1460. The RSI has turned lower, which means momentum has shifted. A drop to about $1360 seems possible this week.
5. AMD
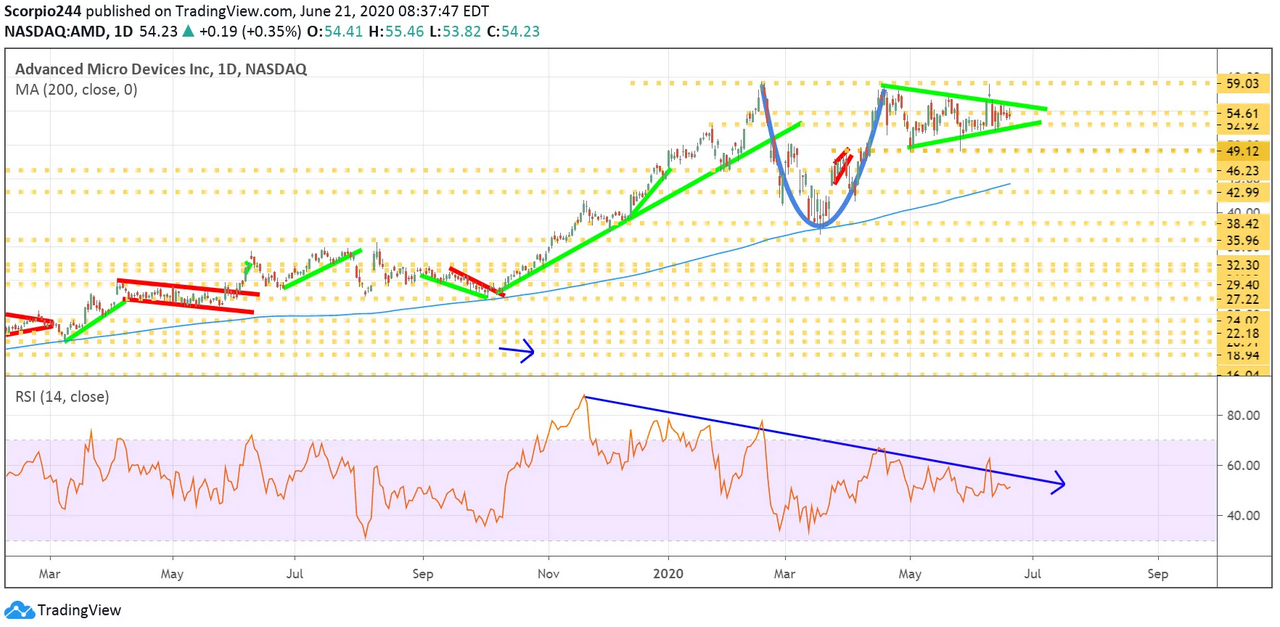
Advanced Micro Devices (NASDAQ:AMD) appears to have formed a cup and handle, and that is a bullish pattern. It seems odd to think it could rise right now, but $59 is likely next stop for the time being.
6. Roku
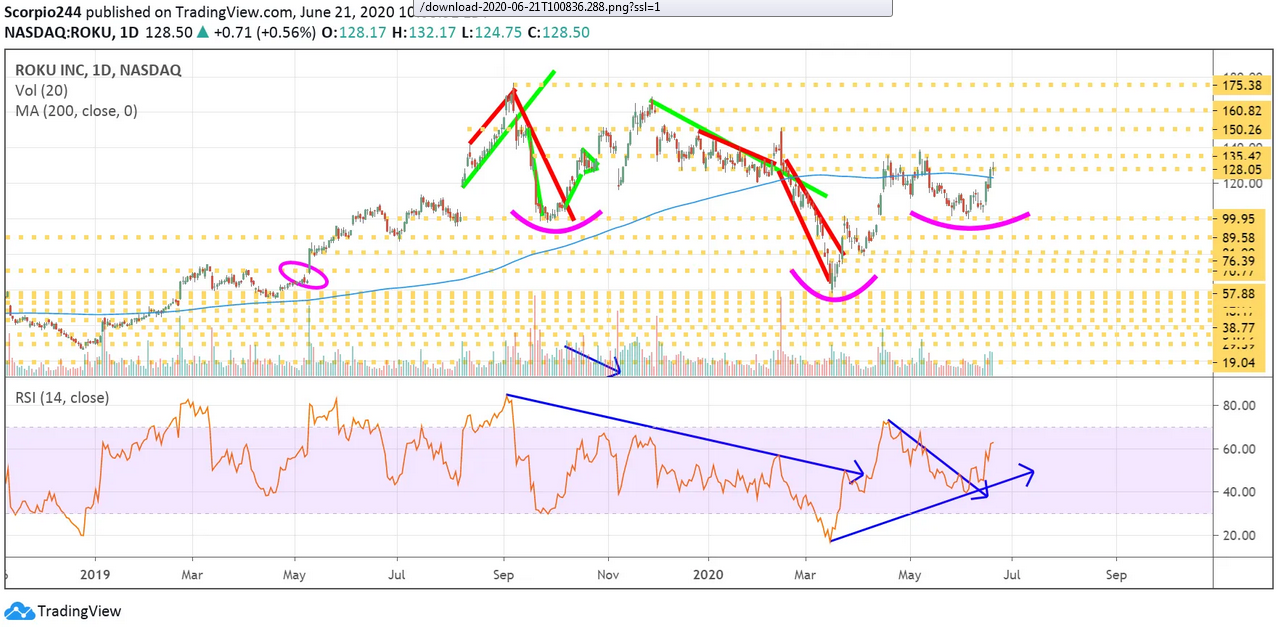
Roku (NASDAQ:ROKU) may be heading higher, oddly enough. It seems like there could very well be a reverse head and shoulders pattern in the stock with an RSI that is trending higher. Perhaps it pushes on to around $151.
7. Qualcomm
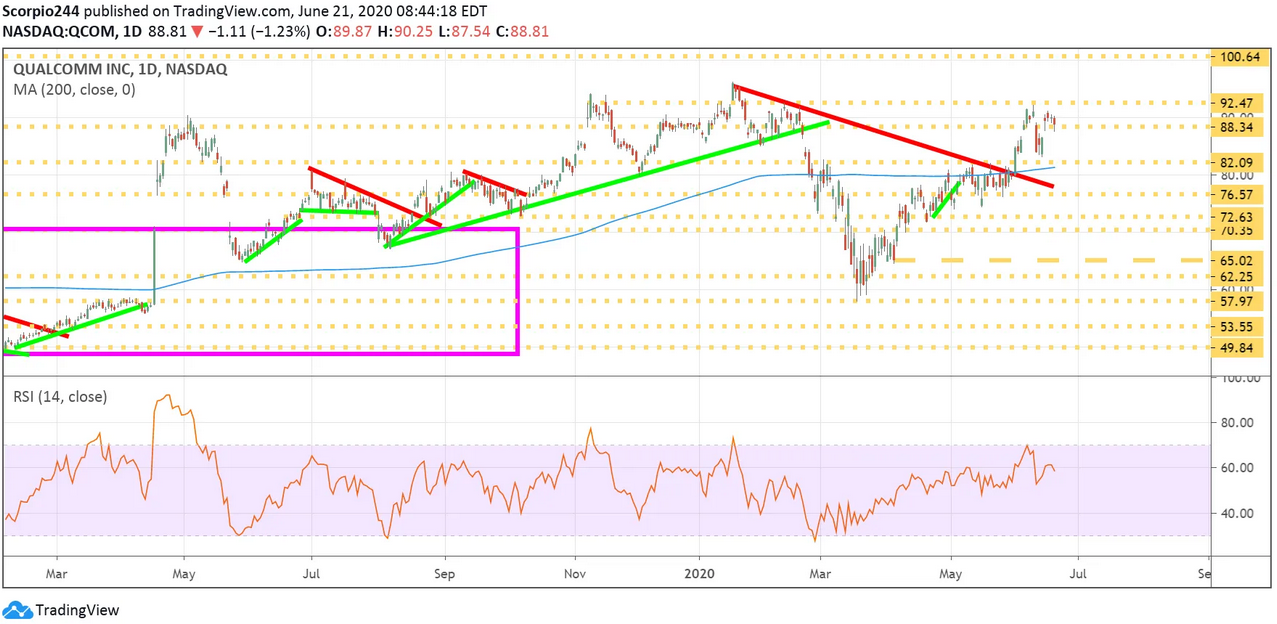
Qualcomm (NASDAQ:QCOM) has formed a bearish divergence, and the chart suggests the shares pullback to around $82.
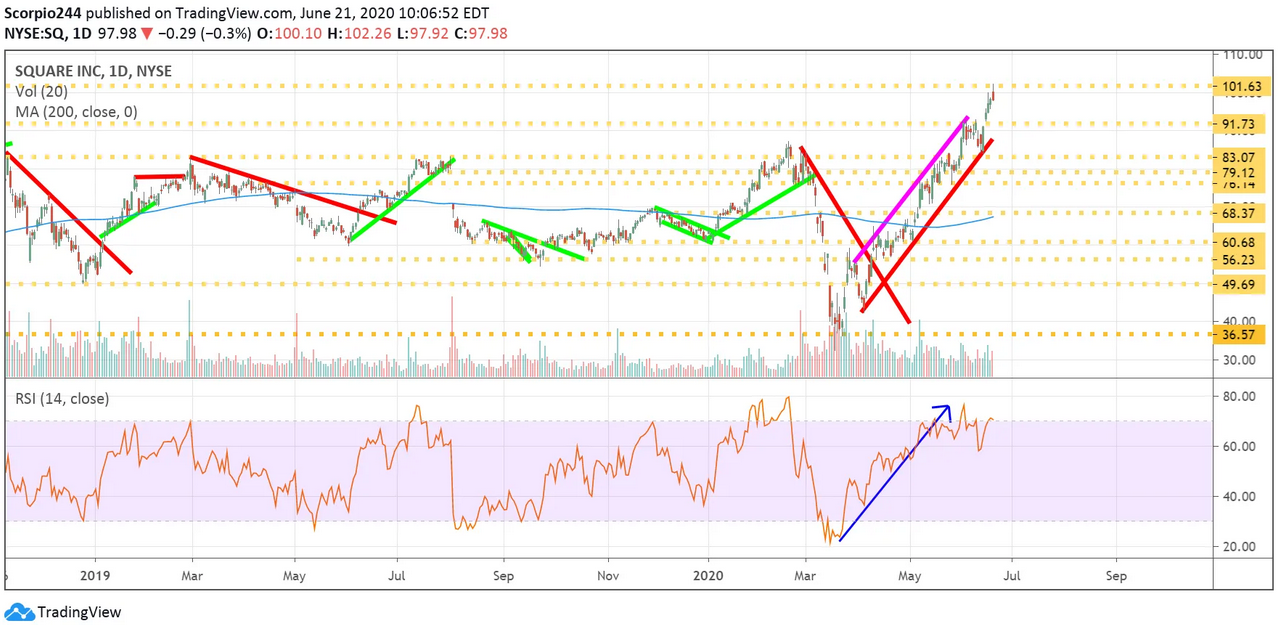
8. Square (SQ)
I think Square (NYSE:SQ) has topped out here. It has formed a bearish divergence, and the stock failed at resistance at $102. A pullback to $92 seems reasonable.
