Get 40% Off
🚨 Volatile Markets? Find Hidden Gems for Serious OutperformanceFind Stocks Now

8 Monster Stock Market Predictions For The Week Of February 3

Published 02/02/2020, 05:42 AM
Updated 09/20/2023, 06:34 AM

It should be an exciting week when trading begins again on Monday. After all, the Chinese markets will open for the first time in a week, and they are likely to be down a lot. The S&P 500 is down about 3.5% since January 24, while the South Korea KOSPI is down over 6%, and the HK Hang Seng is down about 6% too. So could Shanghai move down 7,8,9, or even 10% on Monday? It certainly seems possible.

Regardless the beginning of the week is not likely to be good for the markets. Then layer in the ISM manufacturing data on Monday, the ADP Job Report, ISM- Non, and the BLS job report, and there plenty of things that could pile up quickly.
S&P 500 Daily Chart

S&P 500 (SPY)

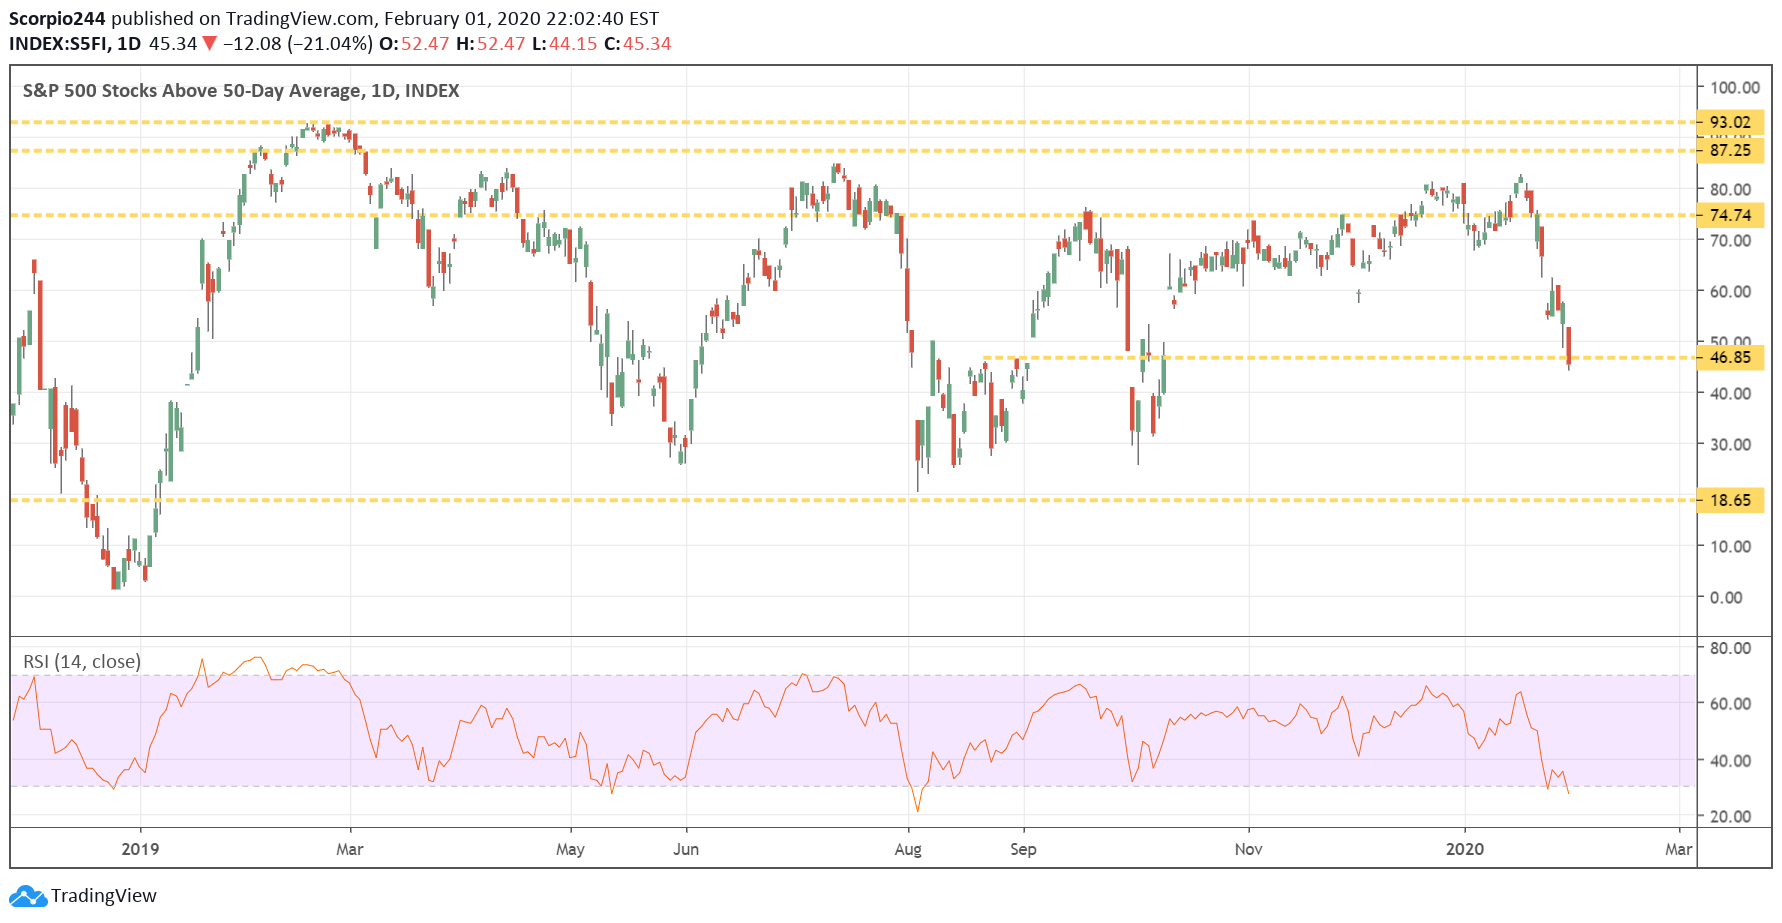
The number of S&P 500 stocks above their 50 day moving average is still around 47%, and my hunch is that it still has to fall further, probably to about 25%.

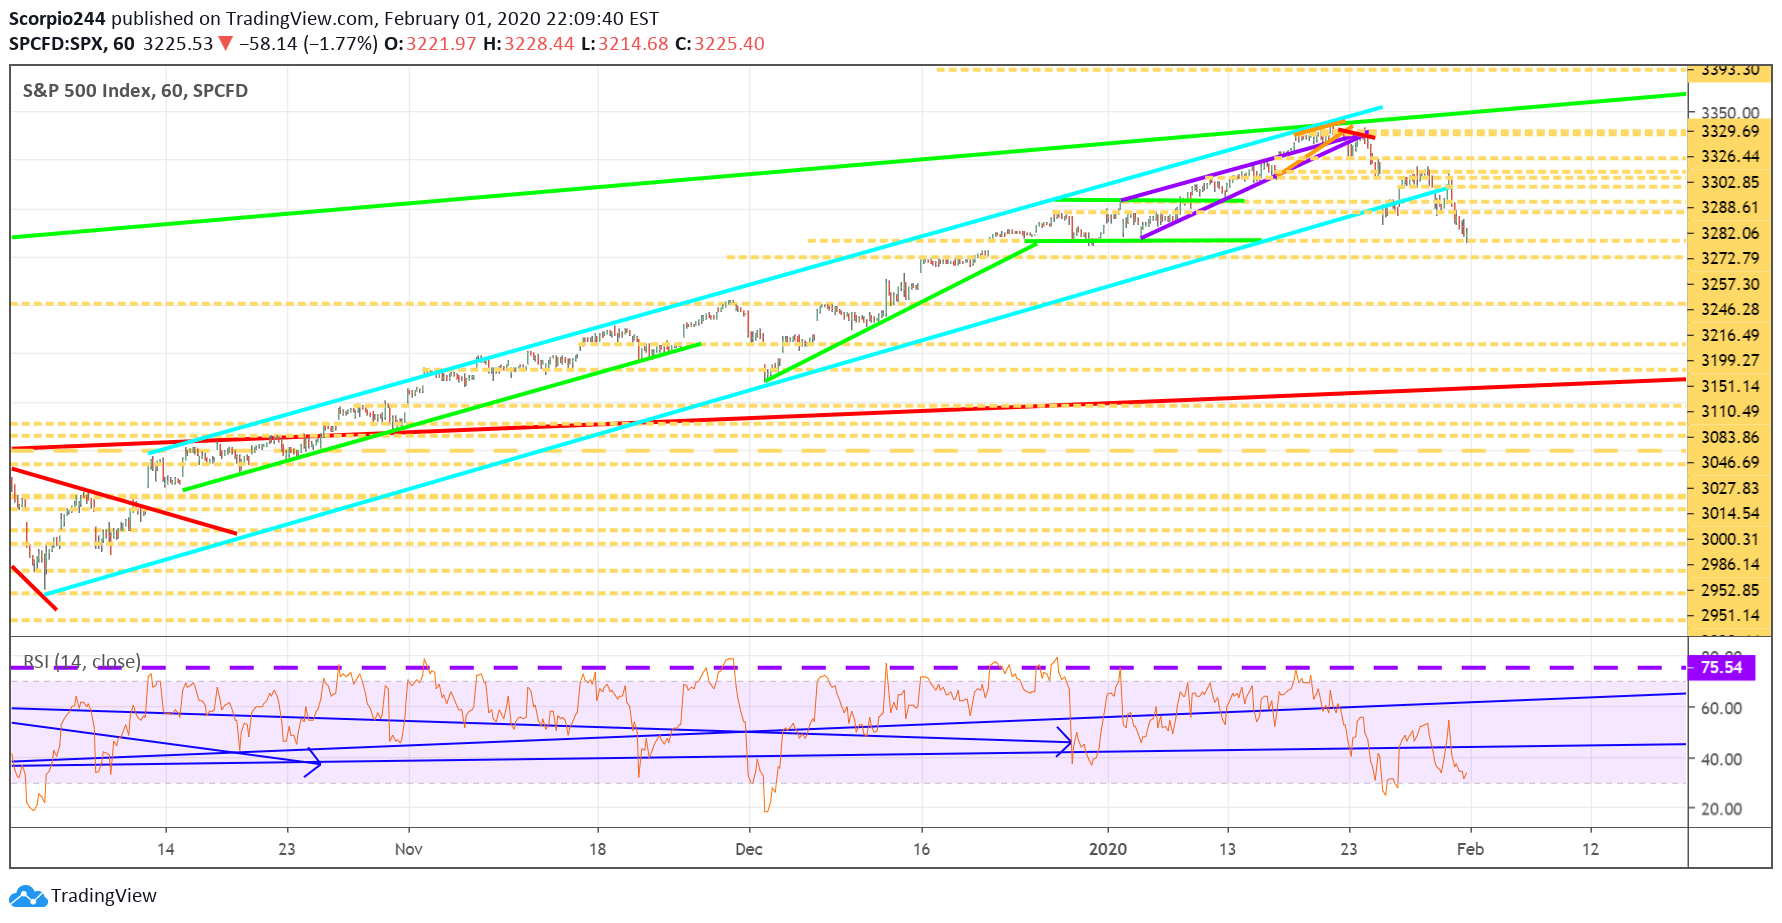
For now, 3,150 seems reasonable for the S&P 500 to fall too. It is about 5.5% off the all-time highs and appears to have decent support in that region.
S&P 500 Index 60 Minute Chart

It is only about 2.5% from Friday’s close, so we could see that level by lunchtime on Monday, especially with the speeds these markets move.

Amazon (AMZN)

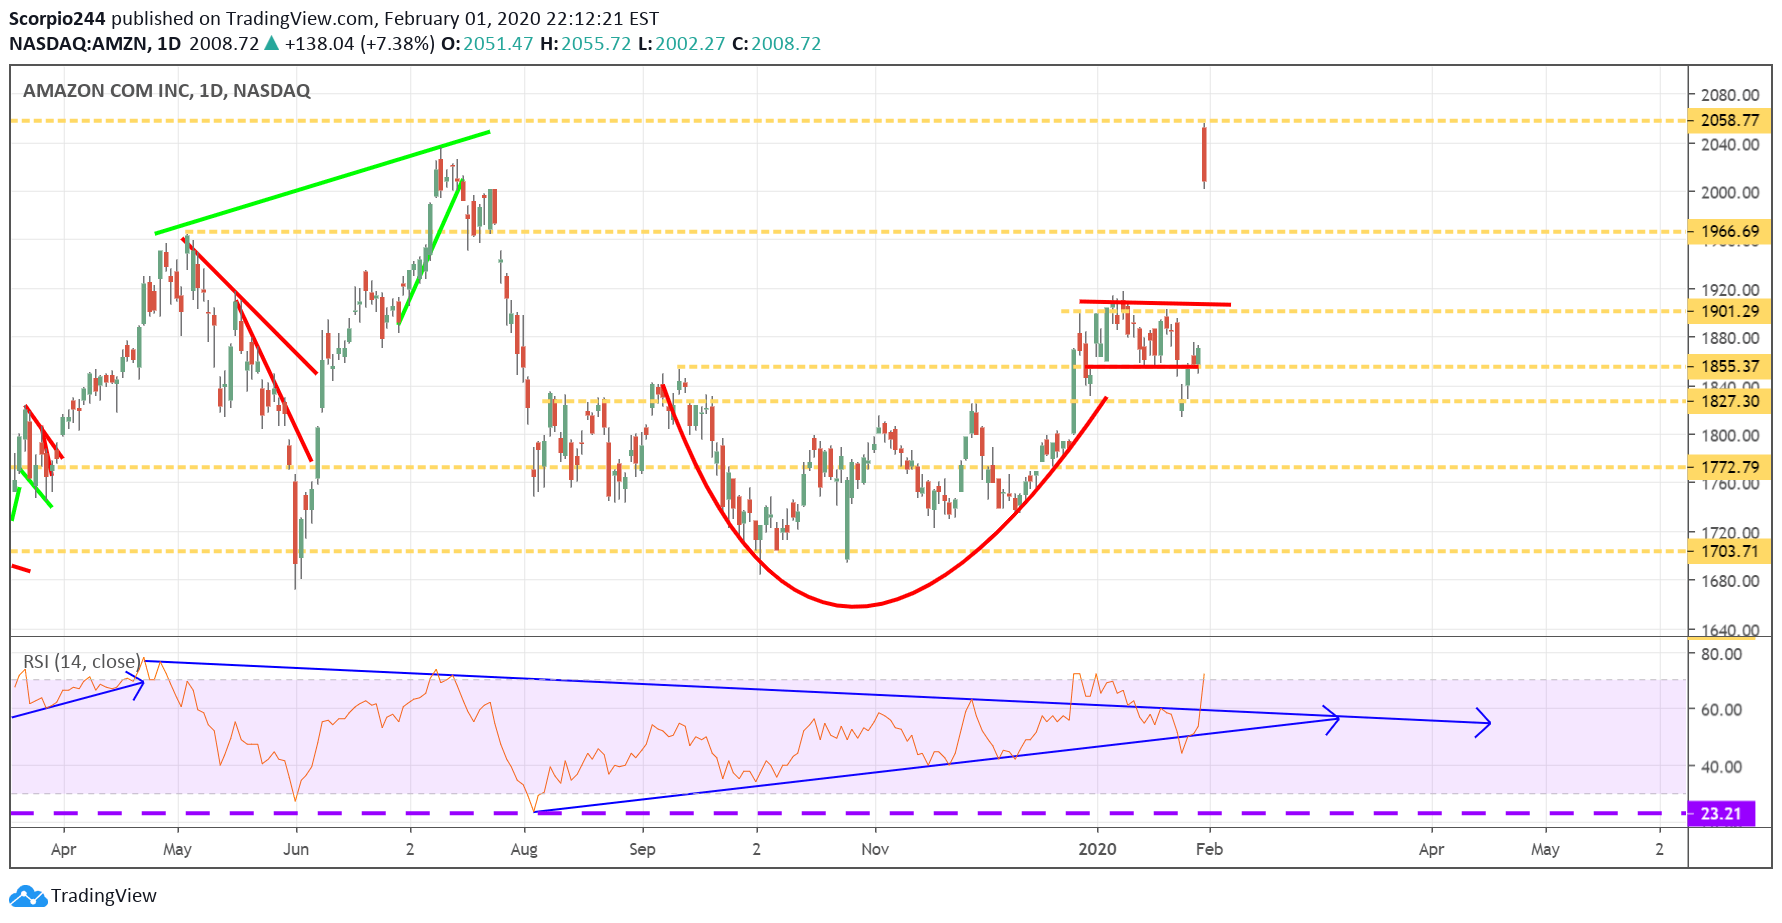
I’d be careful with Amazon (NASDAQ:AMZN), the stock now has a giant gap to fill, and it is clear as day the market wants $2,060 to be resistance. Watch for a move lower to $1966.
3rd party Ad. Not an offer or recommendation by Investing.com. See disclosure here or remove ads .
Amazon Inc Daily Chart

Netflix (NFLX)

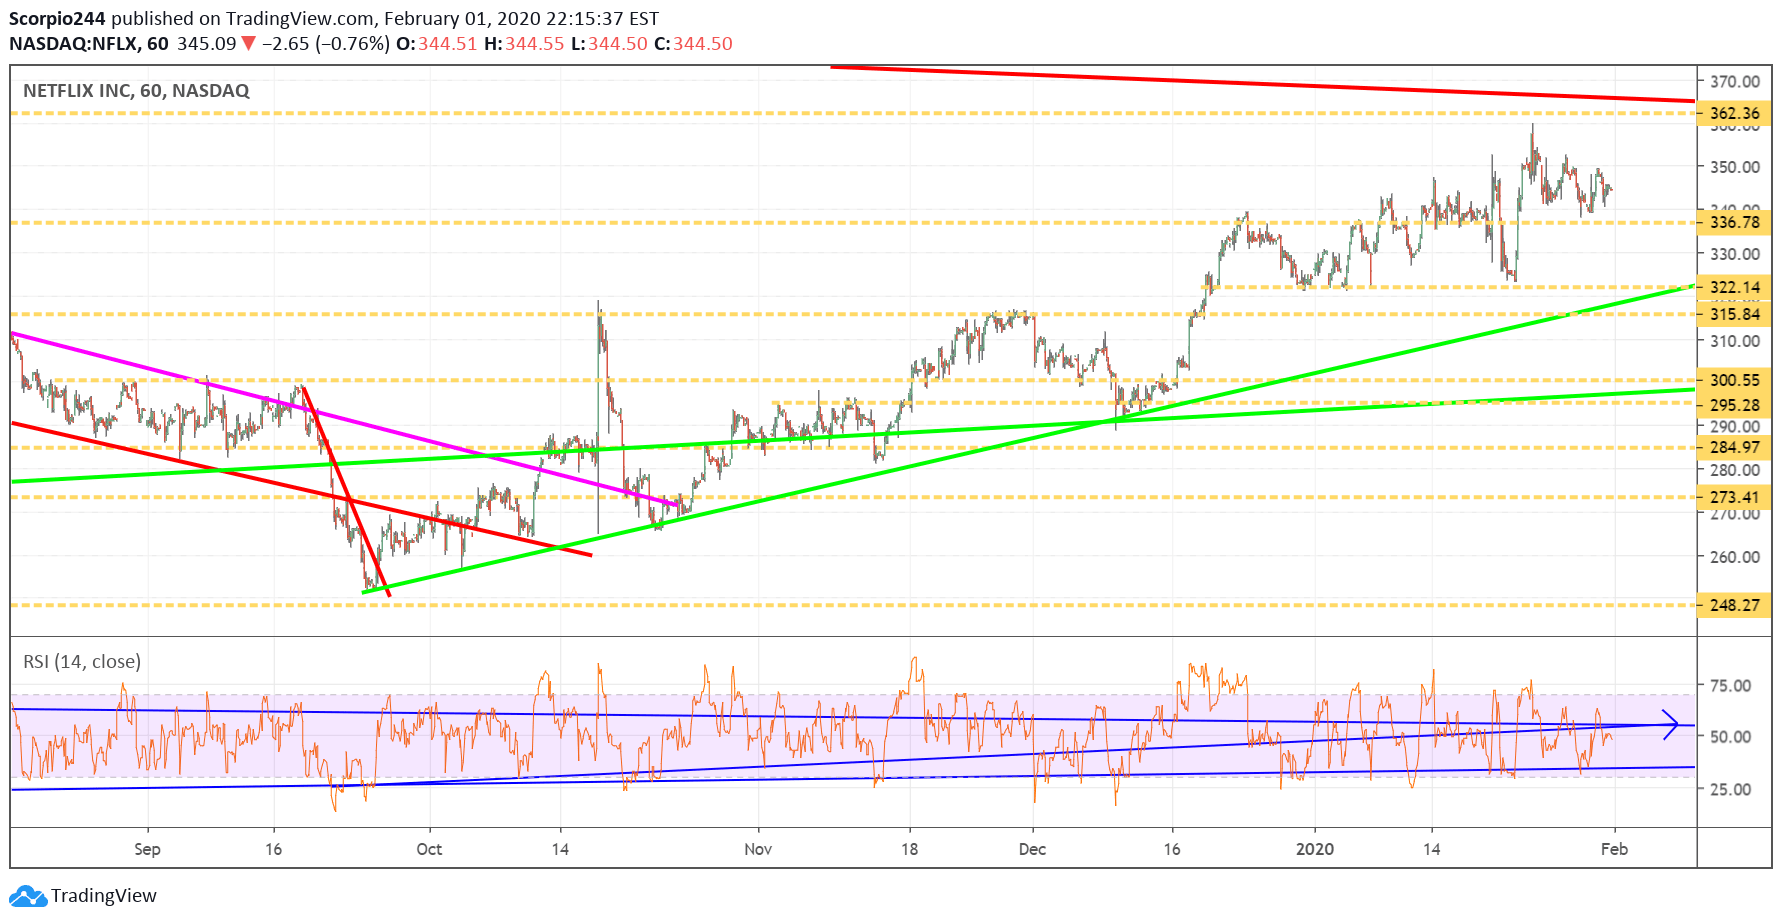
Now that nobody is going outside anymore, it seems like a perfect time to sign-up for Netflix (NASDAQ:NFLX) and binge some of our favorite shows like Stranger Things or finish off the Irishman. The stock appears to be acting pretty well. The stock hardly budge this last week, I think it will continue to hold $340, but I already told you that.
Netflix Chart

Disney (DIS)

The same thing may apply to Disney with its streaming service. Then again, they do have those theme parks. But actually, they have a minority interest in Disney Shanghai and Hong Kong, did you know that?

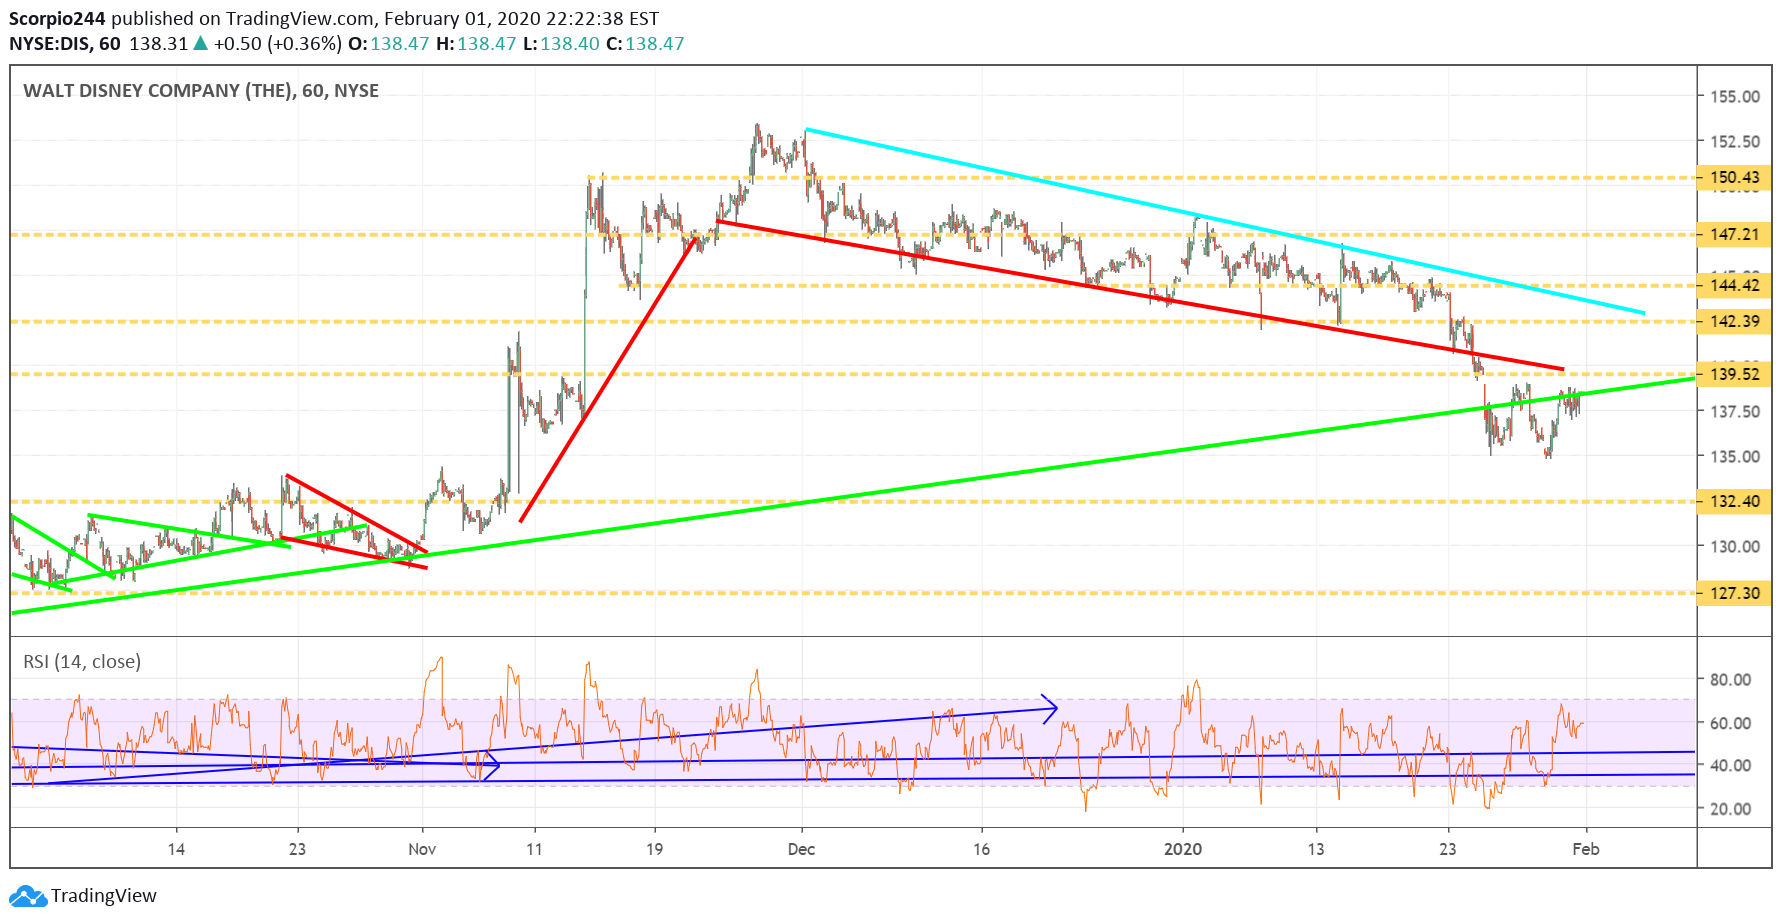
Anyway, I noted some bullish option betting in Disney last week, and I saw it again this week. The stock held up pretty well on Friday despite the selling in the market. Probably bodes well for the post-earnings report, with shares rising back to $150.
Walt Disney Chart

Alibaba (BABA)

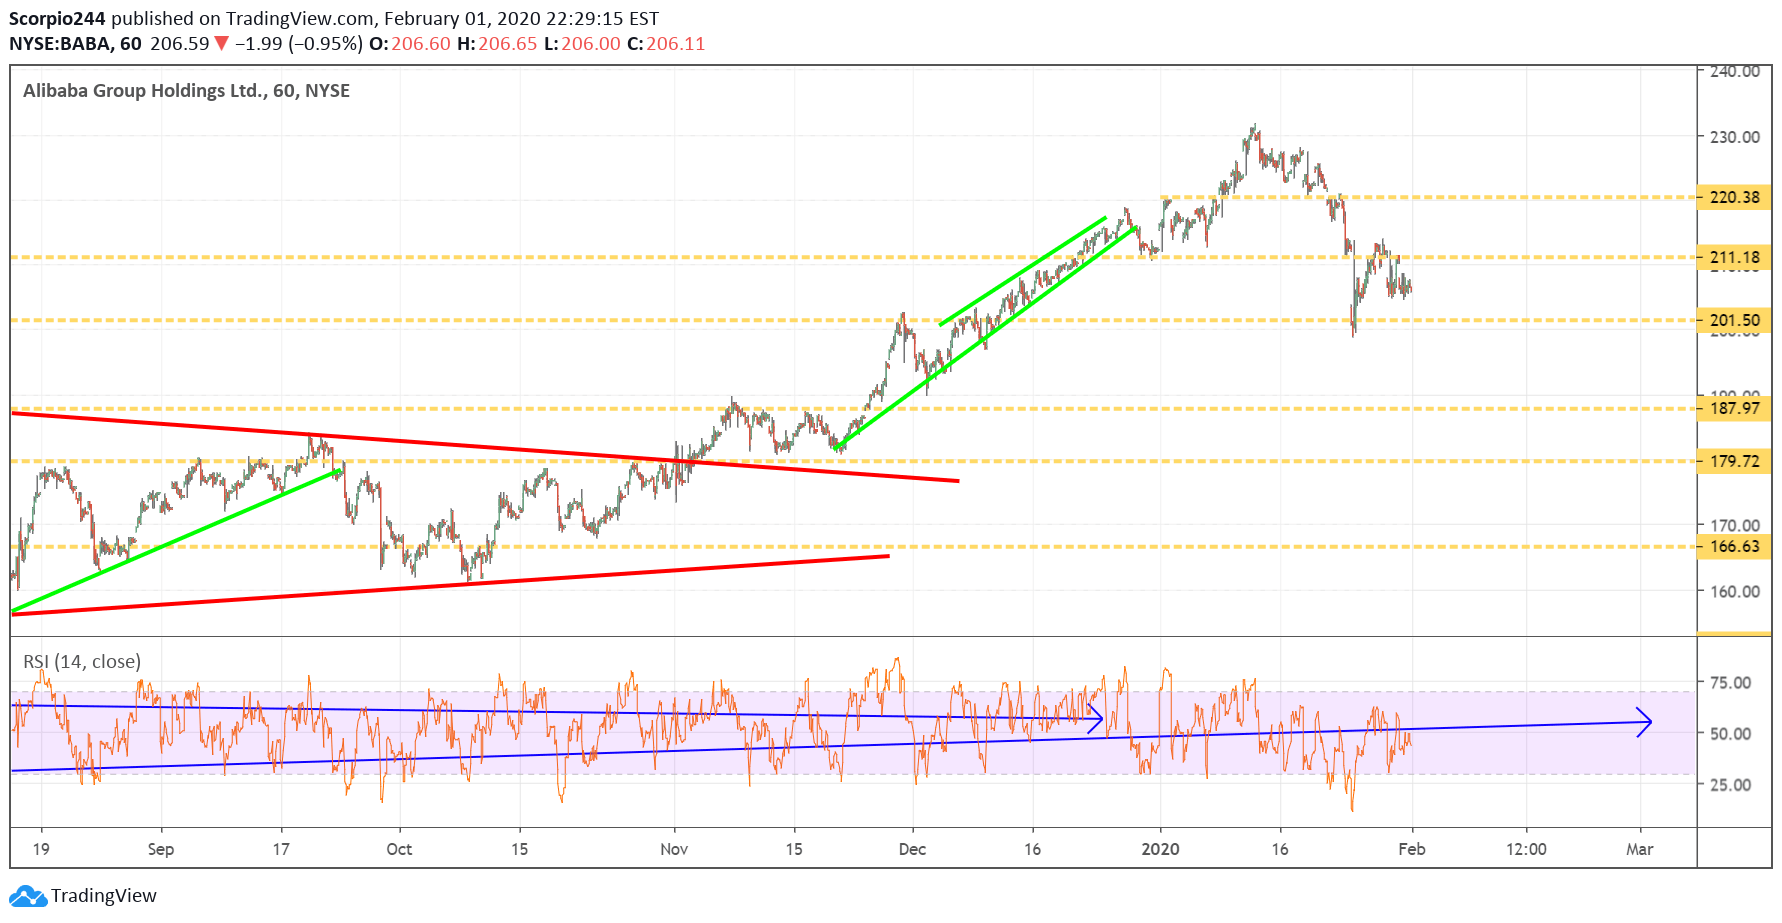
It is not likely a good week for Alibaba (NYSE:BABA), just because it will likely serve as a proxy for China. A break below $201 probably moves this one lower to $187.
Alibaba Chart

JD.com (JD)

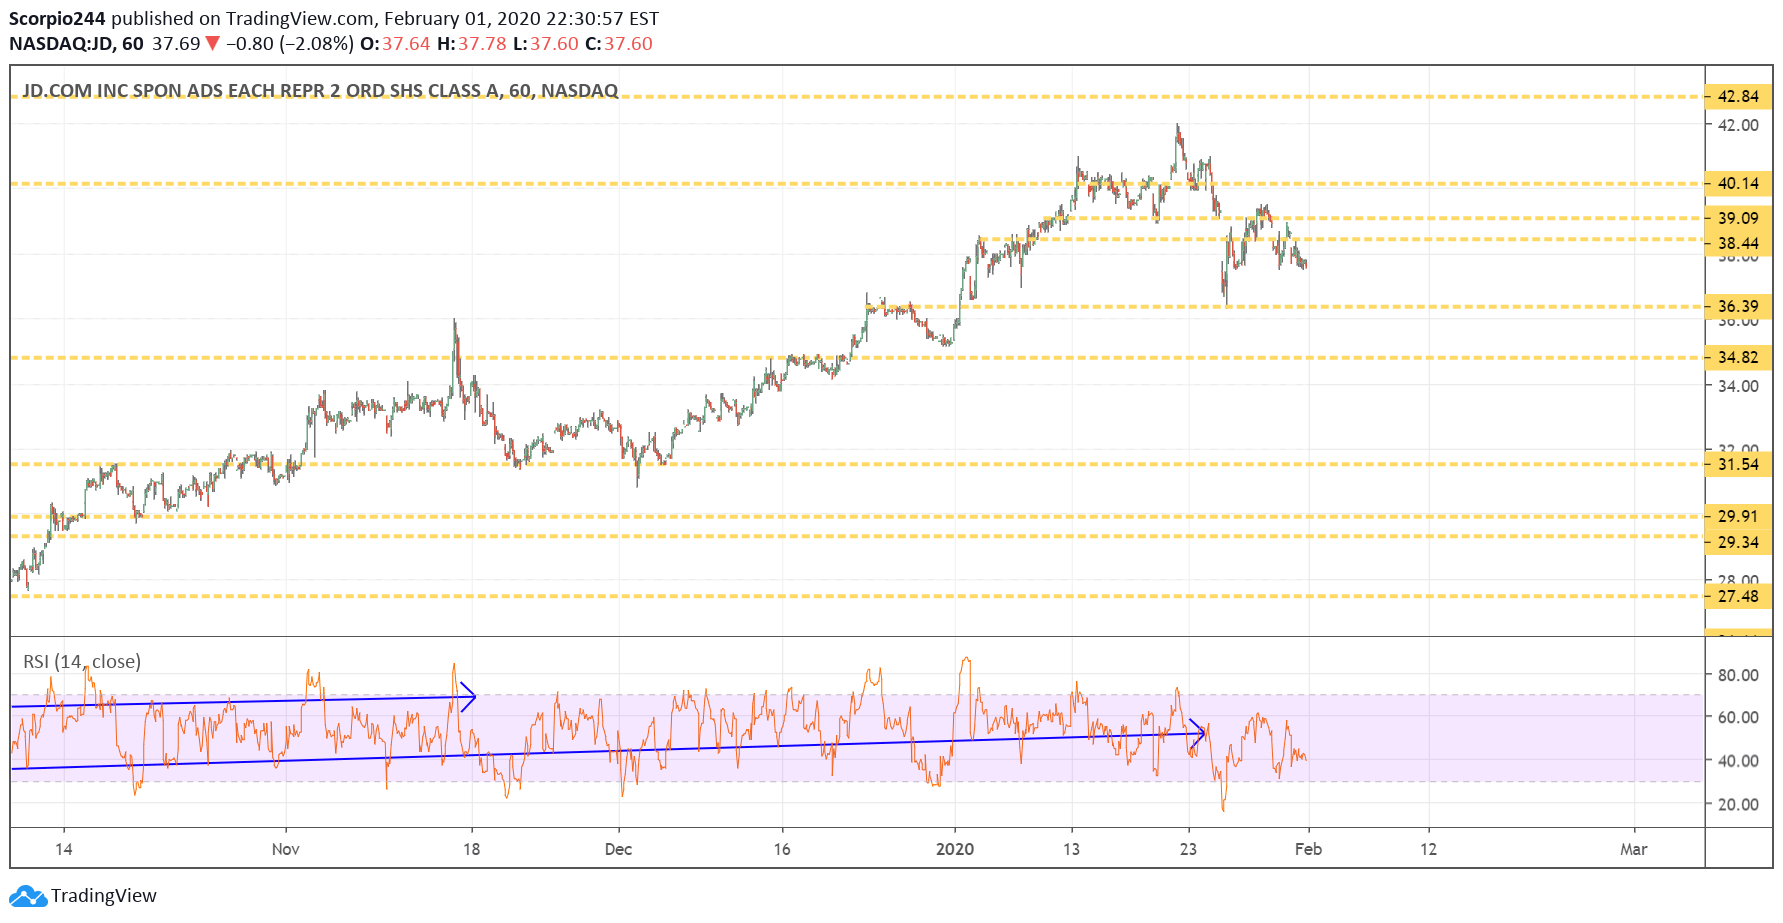
The same can probably be said for JD.com, with shares likely heading back to $36.40.
JD.com Chart

Facebook (FB)

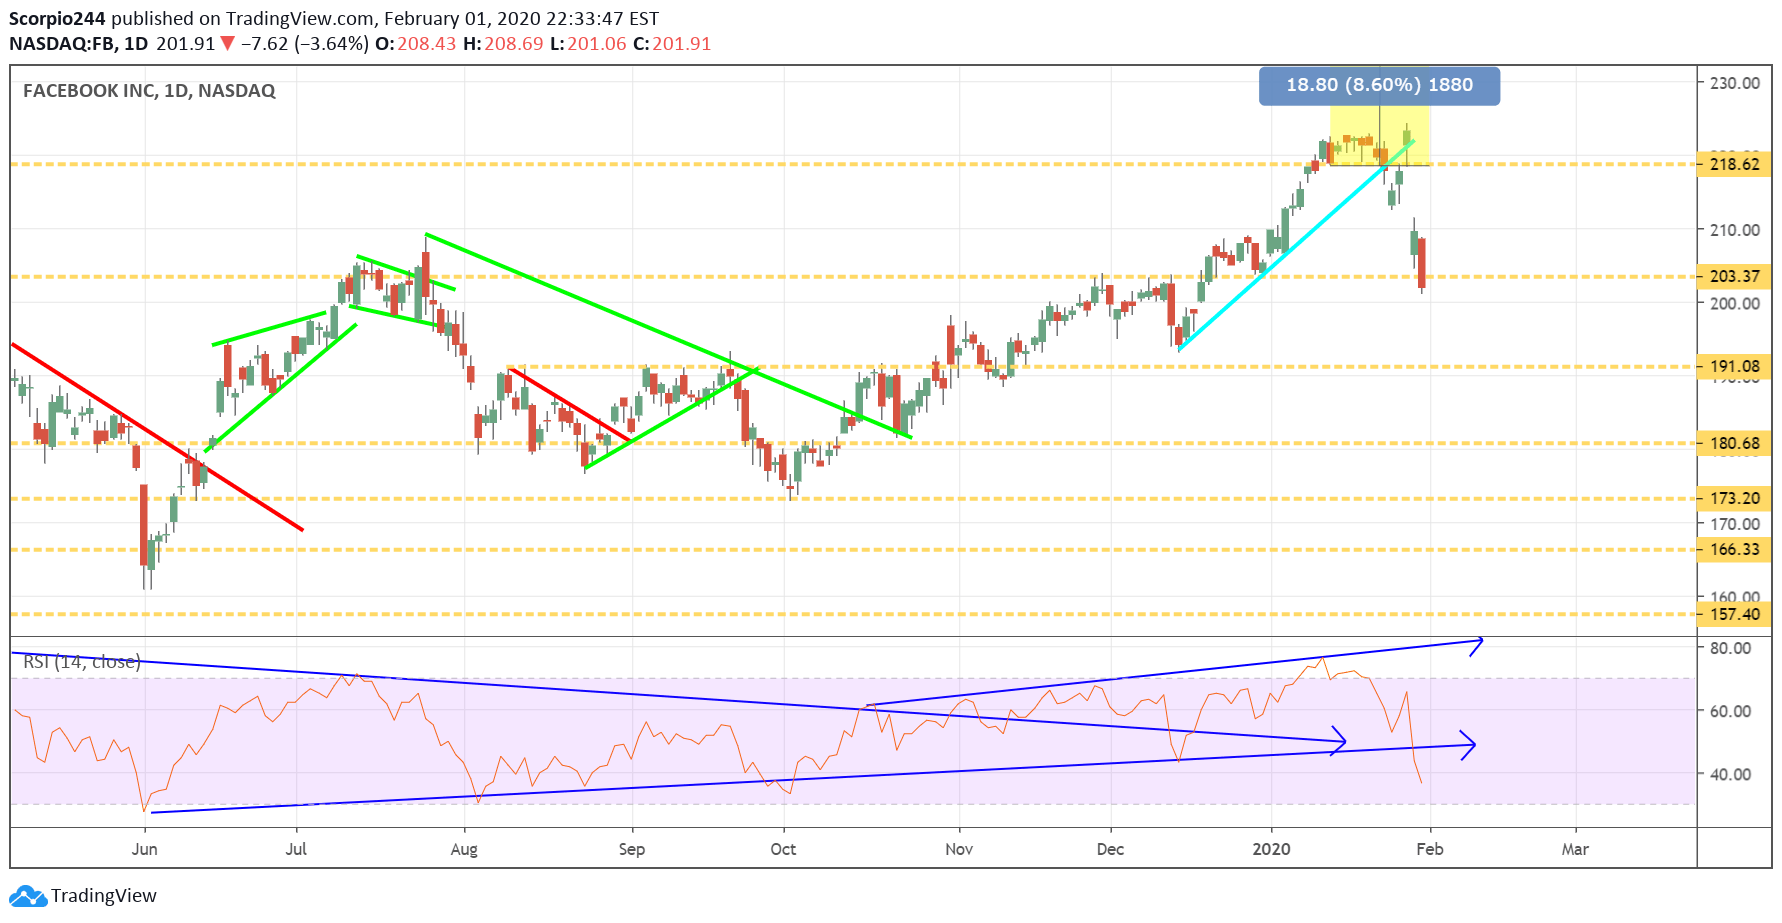
Facebook (NASDAQ:FB) fell through support at $203, and I think that sets up that drop to $191.
Facebook Inc Daily Chart

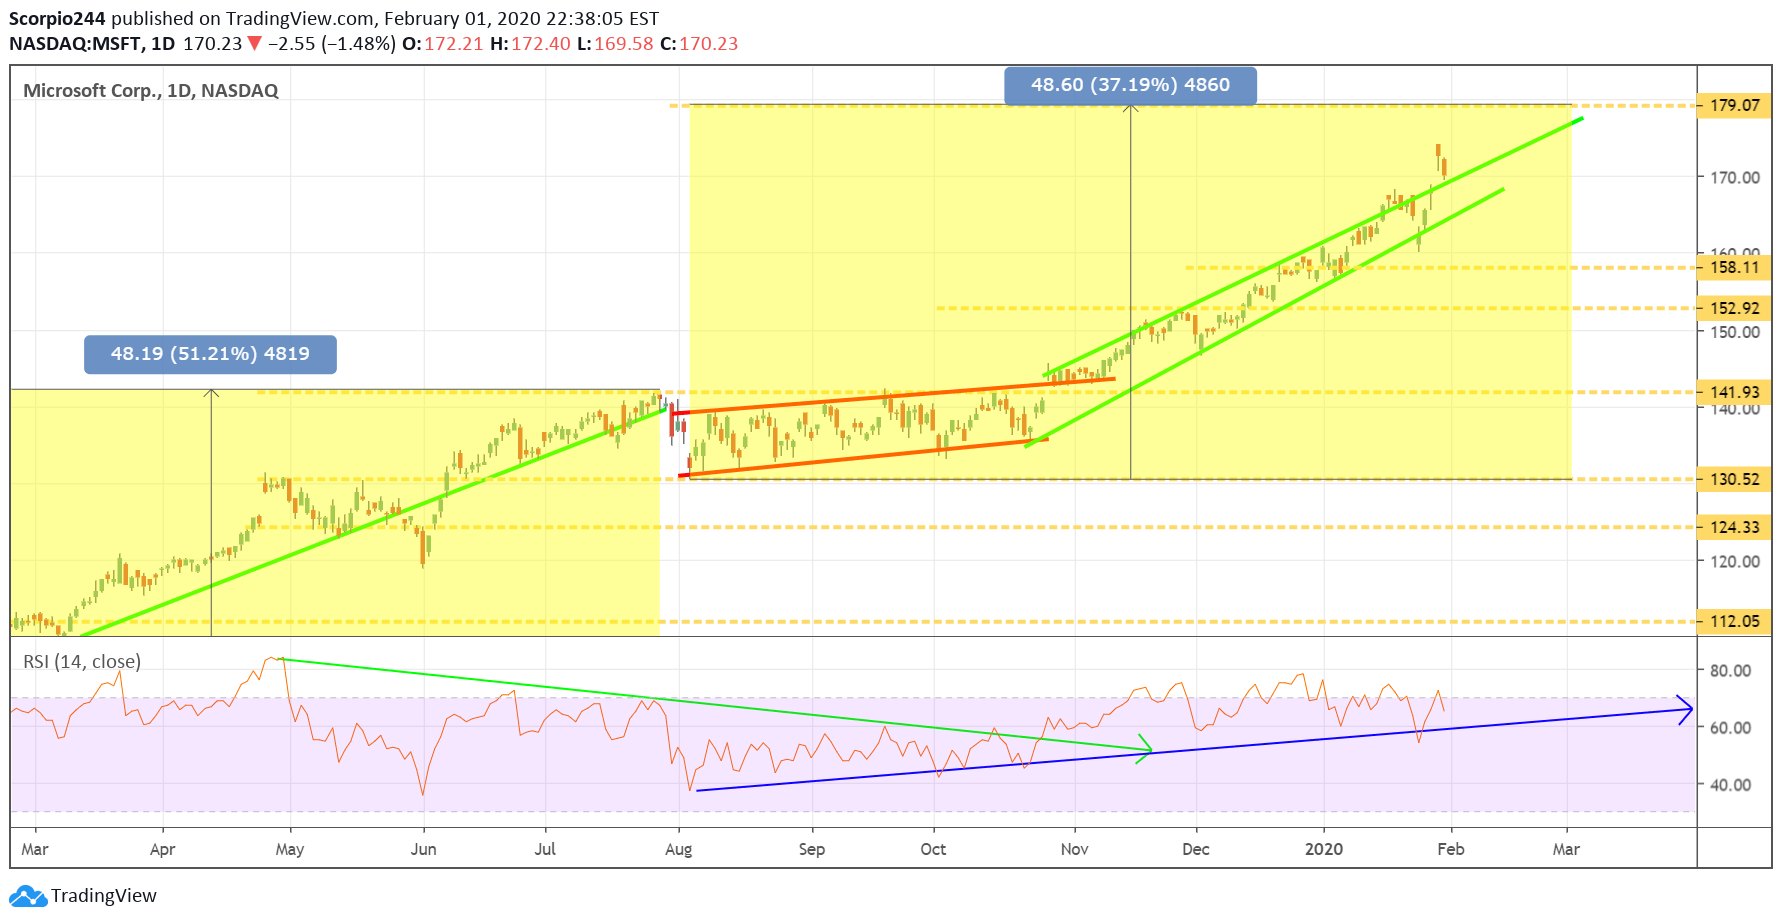
Microsoft (MSFT)

Microsoft (NASDAQ:MSFT) has come a long way in recent weeks, and I think the stock could fall back to around $165.
3rd party Ad. Not an offer or recommendation by Investing.com. See disclosure here or remove ads .
Microsoft Daily Chart

Original Post

Latest comments

Great, thank you
the bounce is clearly manipulative move. the levels you mentioned however may reach by Thur or Friday. they can't keep pumping each day but then this market is not reality of our world
thanks
spettacular analysis
Risk Disclosure: Trading in financial instruments and/or cryptocurrencies involves high risks including the risk of losing some, or all, of your investment amount, and may not be suitable for all investors. Prices of cryptocurrencies are extremely volatile and may be affected by external factors such as financial, regulatory or political events. Trading on margin increases the financial risks.
Before deciding to trade in financial instrument or cryptocurrencies you should be fully informed of the risks and costs associated with trading the financial markets, carefully consider your investment objectives, level of experience, and risk appetite, and seek professional advice where needed.
Fusion Media would like to remind you that the data contained in this website is not necessarily real-time nor accurate. The data and prices on the website are not necessarily provided by any market or exchange, but may be provided by market makers, and so prices may not be accurate and may differ from the actual price at any given market, meaning prices are indicative and not appropriate for trading purposes. Fusion Media and any provider of the data contained in this website will not accept liability for any loss or damage as a result of your trading, or your reliance on the information contained within this website.
It is prohibited to use, store, reproduce, display, modify, transmit or distribute the data contained in this website without the explicit prior written permission of Fusion Media and/or the data provider. All intellectual property rights are reserved by the providers and/or the exchange providing the data contained in this website.
Fusion Media may be compensated by the advertisers that appear on the website, based on your interaction with the advertisements or advertisers.
© 2007-2024 - Fusion Media Limited. All Rights Reserved.