It will be a busy week for the stock market, especially on Wednesday when the FOMC concludes its meeting and hosts its usual press conference. I am not expecting anything to change with this meeting; I don’t see what the Fed can do to change anything materially.
It is possible the Fed could look to increase the purchase of QE, or perhaps do something like an operation Twist, where they sell the shorter-dated Treasury holdings and reinvest the money back into the longer-dated maturities to help control the long end of the curve a bit more.
But at this point, with the 10-year yield up just 20 bps or so since the last meeting, it doesn’t seem like a time to freak out on that front. But if the Fed wanted to send an aggressive message about keeping rates low, that is one thing they could do.
Additionally, this week will be quadruple witching and the S&P 500 rebalance, along with the addition of Tesla (NASDAQ:TSLA) to the index.
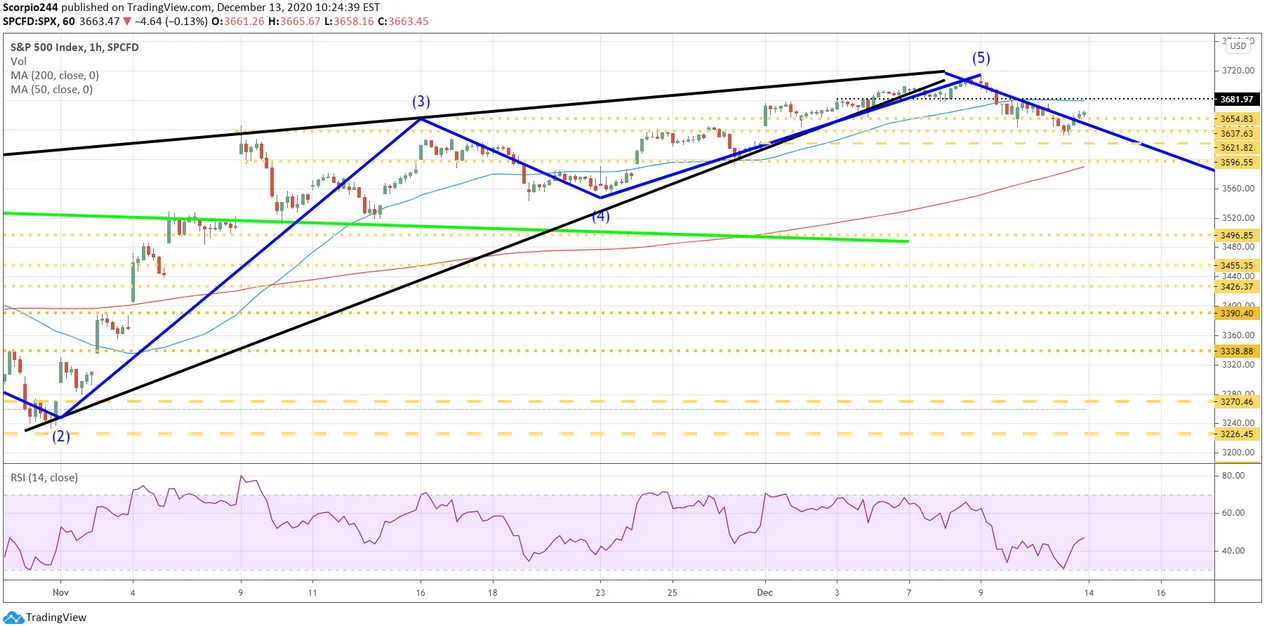
S&P 500
This week, the likelihood is that the S&P 500 heads lower, based on the current trends we have been observing. The uptrend in the index is broken, suggesting a drop with the potential to fill a technical gap around 3,620. Should it rise, which is possible on its path to 3,620, there should be firm resistance at 3,680.
Amazon
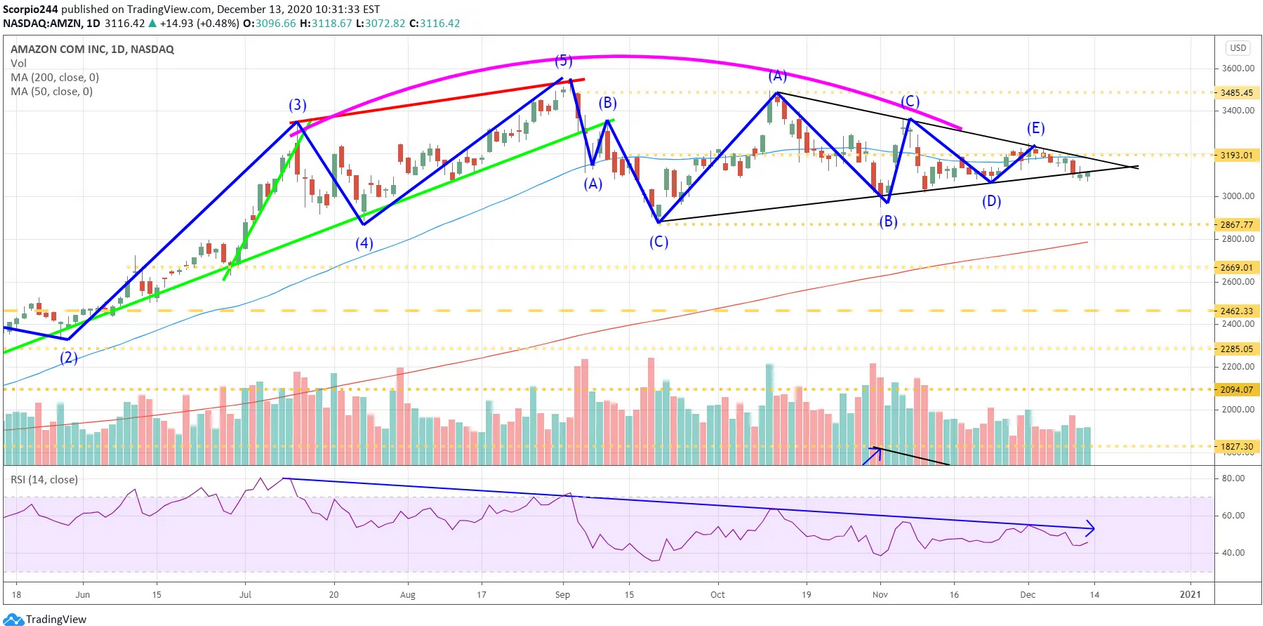
Amazon (NASDAQ:AMZN) possesses several bearish patterns, such as a triangle pattern, an RSI that is trending lower, and weaker volume levels. This past week, the stock fell below the uptrend around $3,120, which I think sets up a drop to around 2,870 over the next few weeks.
Broadcom
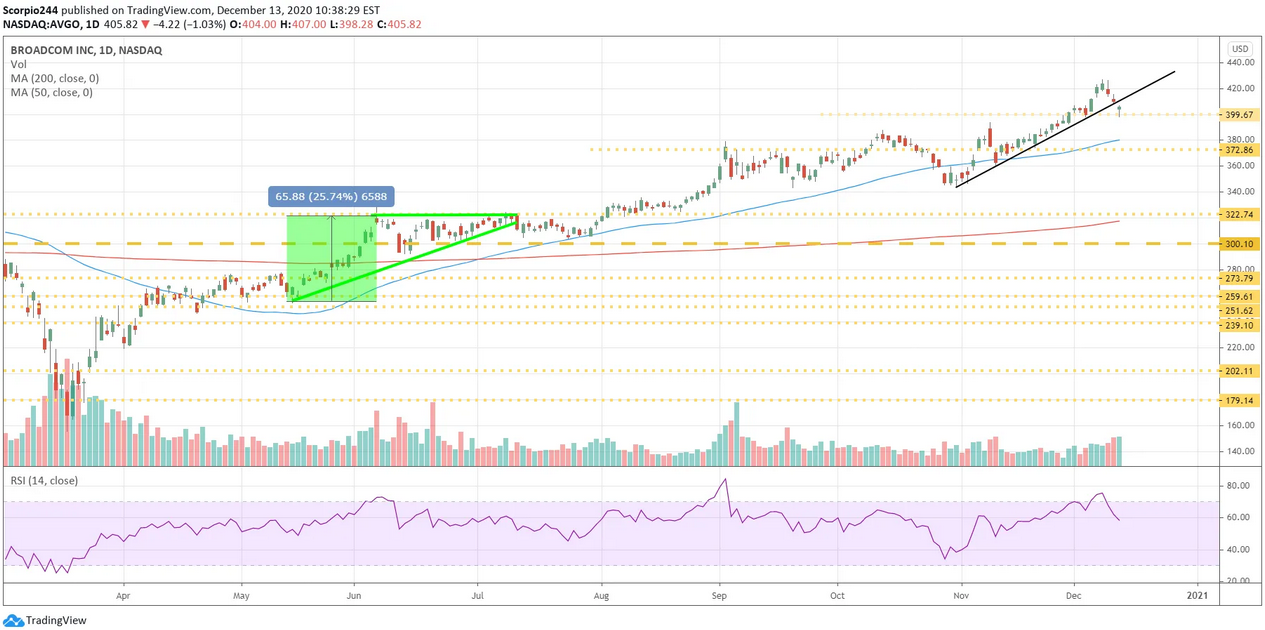
Broadcom (NASDAQ:AVGO) broke an uptrend last week after it reported results. For now, it is holding support around $400, and it would not be surprising to see Broadcom retest the breakdown by rising to around $415 before resuming lower towards $372.
Qualcomm
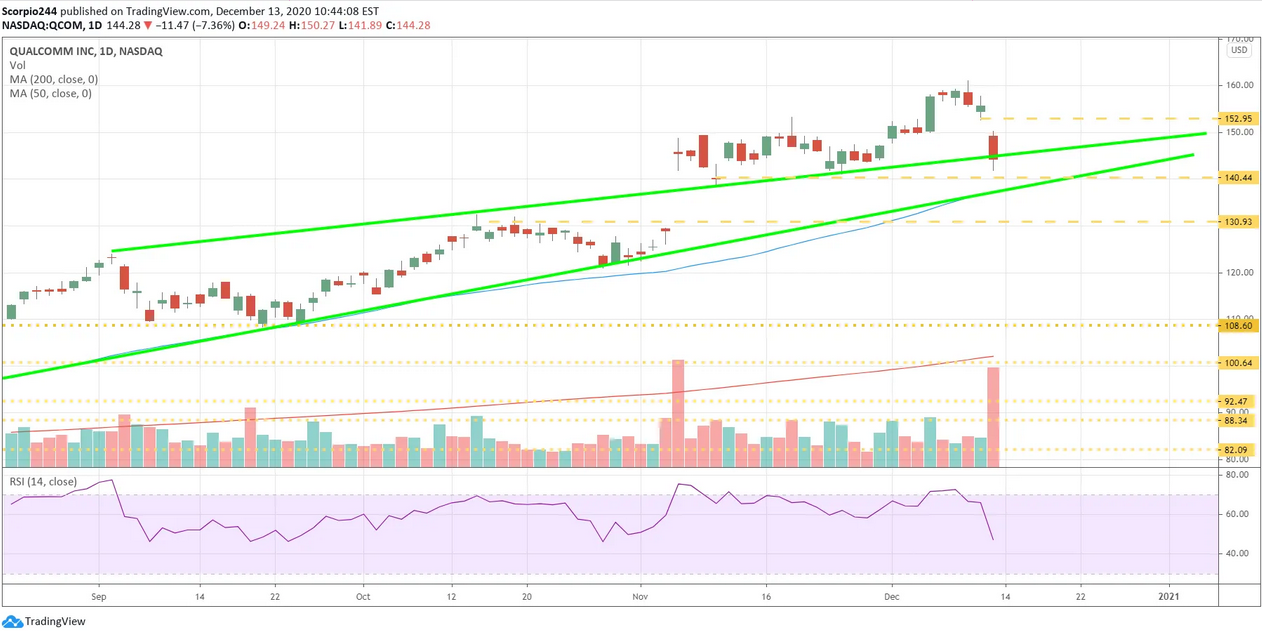
Qualcomm (NASDAQ:QCOM) had a rough Friday, and it may not get any better this week. The news that Apple (NASDAQ:AAPL) is essentially cutting Qualcomm out in the future is bad news for the chipmaker. I think this goes back to the original lawsuit Apple filed some time ago, that both sides managed to work out. Apple seems to be intent on buildings its own supply chain, and that means other Apple suppliers should be on notice as well.
If Qualcomm falls below support at $140, it will work to fill that gap at $131. However, I think before that happens, it will refill the gap up at $153. Look for a quick fill-up to $153 this week, following a push lower towards $140 in the weeks to follow.
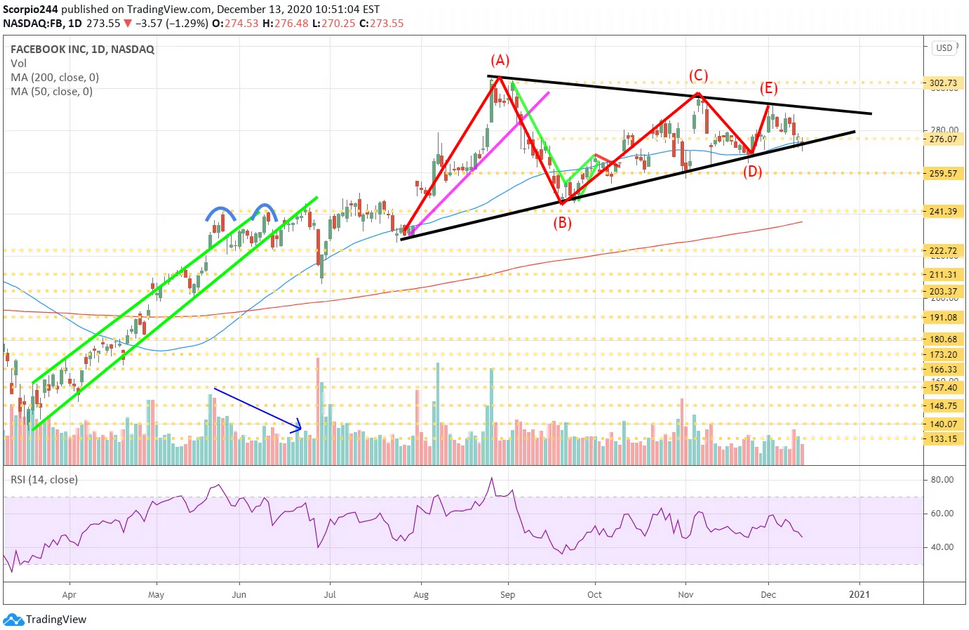
Facebook (NASDAQ:FB) has been consolidating sideways more recently and has an RSI trending lower. This would suggest that the stock is likely heading lower. The ABCDE pattern notes the bearish pattern, and a break of support at $273 sets up a drop to around $260.
GE
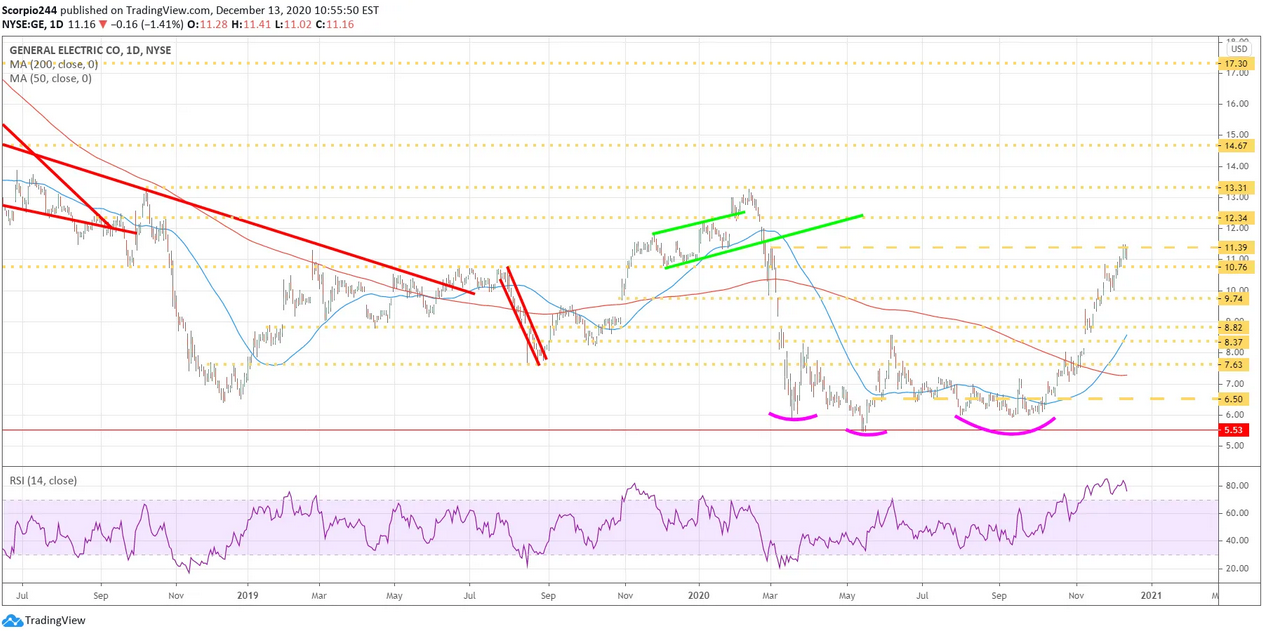
The inverse head-and-shoulders proved to be correct in General Electric (NYSE:GE), and the run-up may be nearing its end. There is one more gap left to fill, around $12.40, which could be the stock’s next stop. The RSI has a double top, and that likely suggests a change in trend is approaching.
Cameco
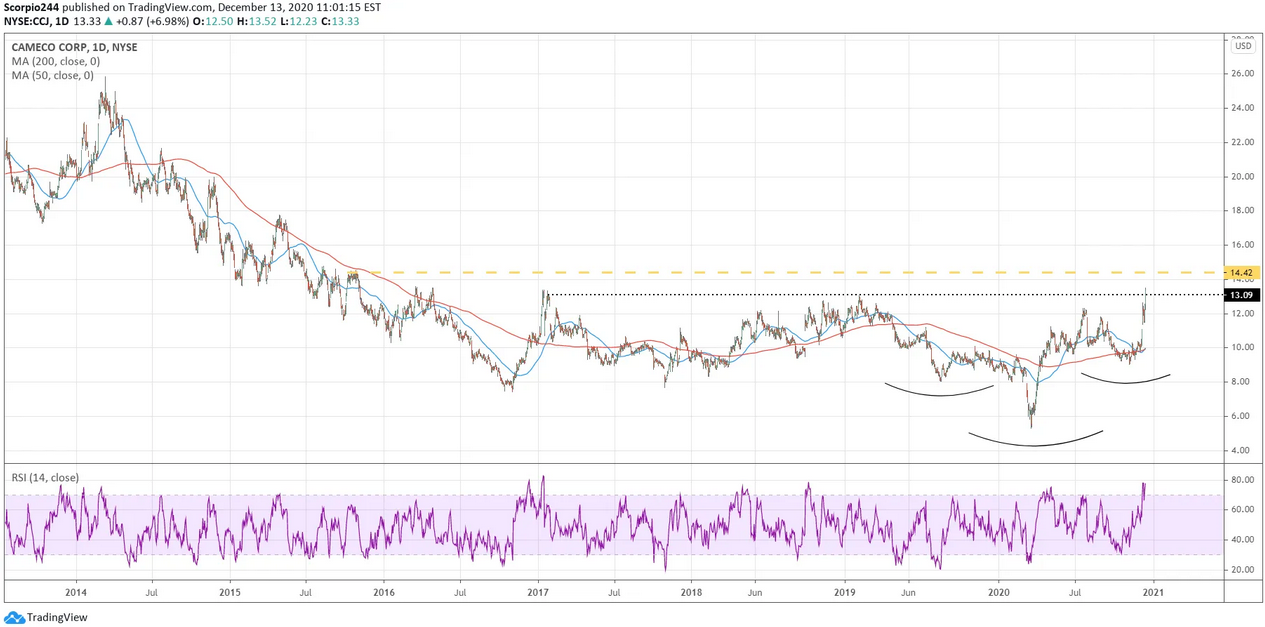
Cameco (NYSE:CCJ) looks like it may have one of those same inverse head and shoulders patterns too. Its next stop could be around $14.50, with support at $12.00.
