There will be a great deal of economic data this week, with the ISM reports and jobs data sets. The positive growth trends are expected to remain in November, with some modest signs of slowing. It will be important for expectations to be met.
It would seem a lot of the big moves we are likely seeing taking place for some of these stocks is short-covering. Look at the Reuter Most Shorted Index versus the S&P 500, Nasdaq 100, and Russell 2000.
That is pretty stunning (the red line being most shorted). A big short-squeeze, for sure.
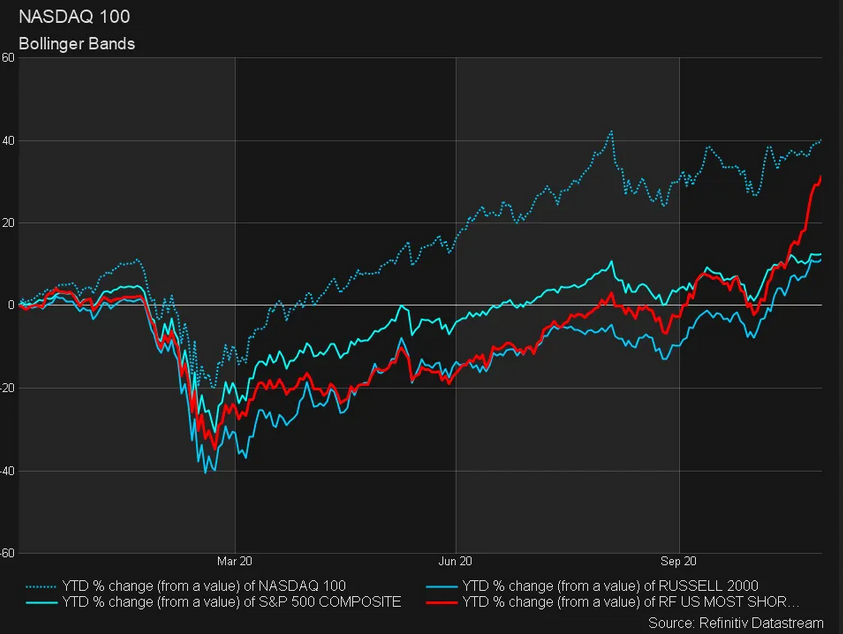
The list’s names are rather shocking, like RH (NYSE:RH), Carvana (NYSE:CVNA), Teladoc (NYSE:TDOC), Sirius (NASDAQ:SIRI), Carnival (NYSE:CUK), Ubiquiti (NYSE:UI) and Plug Power (NASDAQ:PLUG). Anyway, it likely explains a lot.
S&P 500
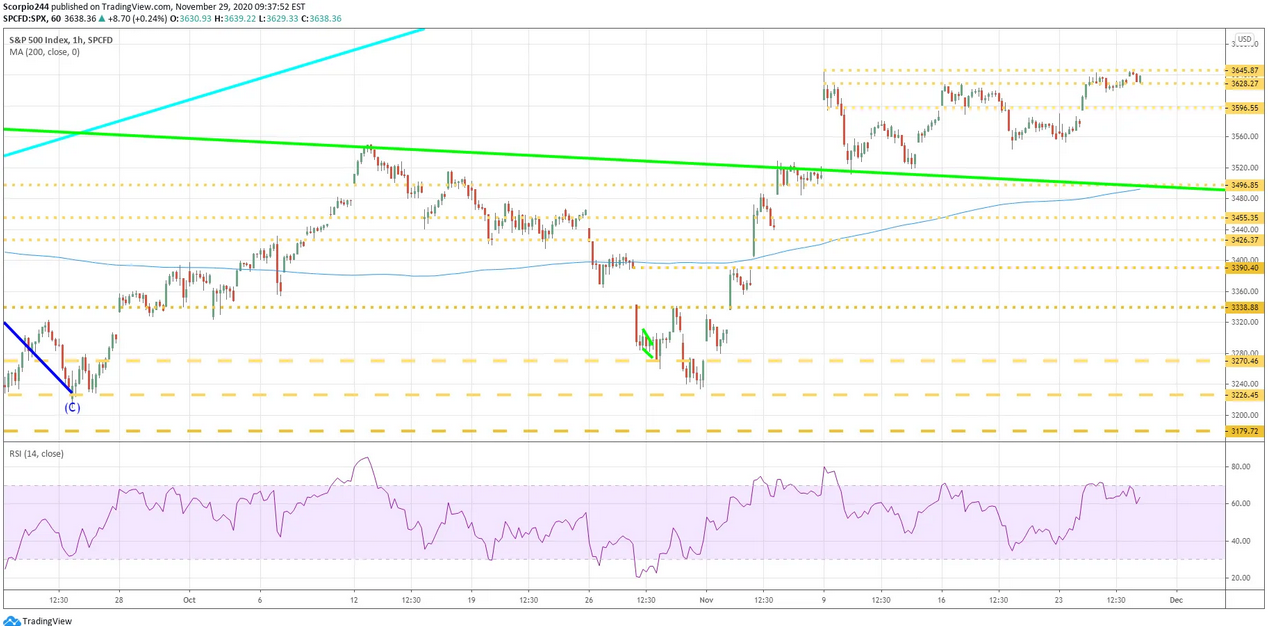
Overall, the S&P 500 is still stuck in that trading range that started the day Pfizer (NYSE:PFE) announced its vaccine on the coronavirus. For now, the 3,650 level is the upper end of the range, which is strong resistance until broken. A break out at that level will likely put us on a path towards 3,710. However, I think this may be the last move higher before seeing a sharp pullback, which likely takes us back to pre-election levels.
Bitcoin
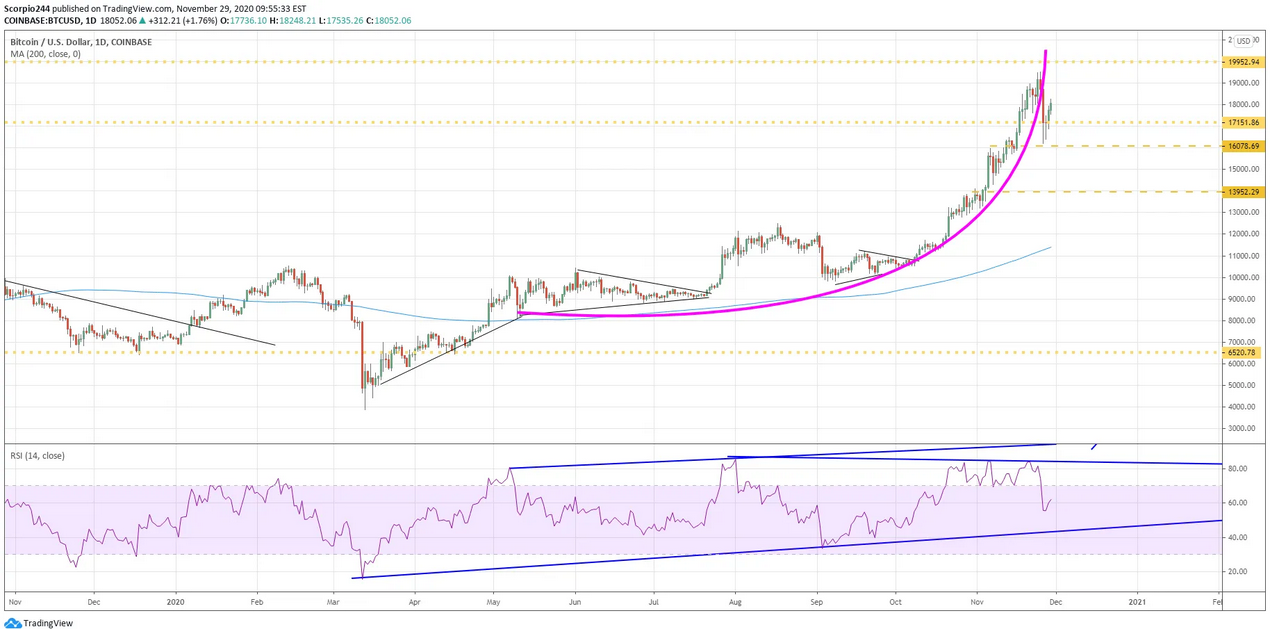
Bitcoin went through its parabolic phase, and now that is over. The currency broke down this week, and I think it likely has some further to fall still. I’m thinking of a drop to around 13,900. I think that bitcoin can serve as a proxy to the risk-on/risk-off sentiment in the equity market.
Alibaba
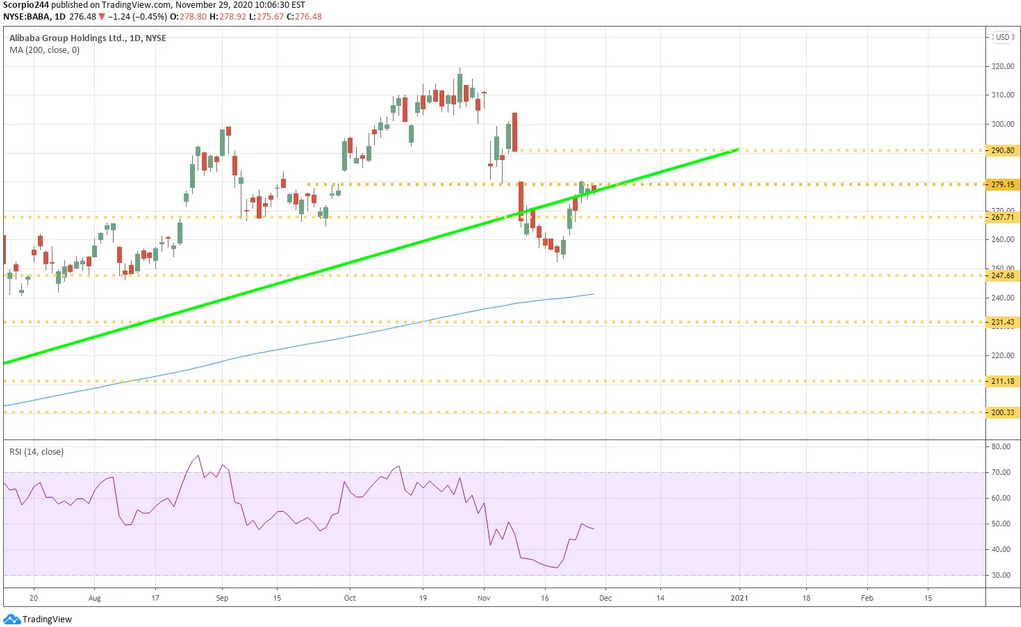
Alibaba (NYSE:BABA) has bounced some in recent days, and it is now retaking its uptrend, which is positive. I also saw some bullish options betting in the stock at the start of last week. I think this one will likely fill the gap around $290.
Square
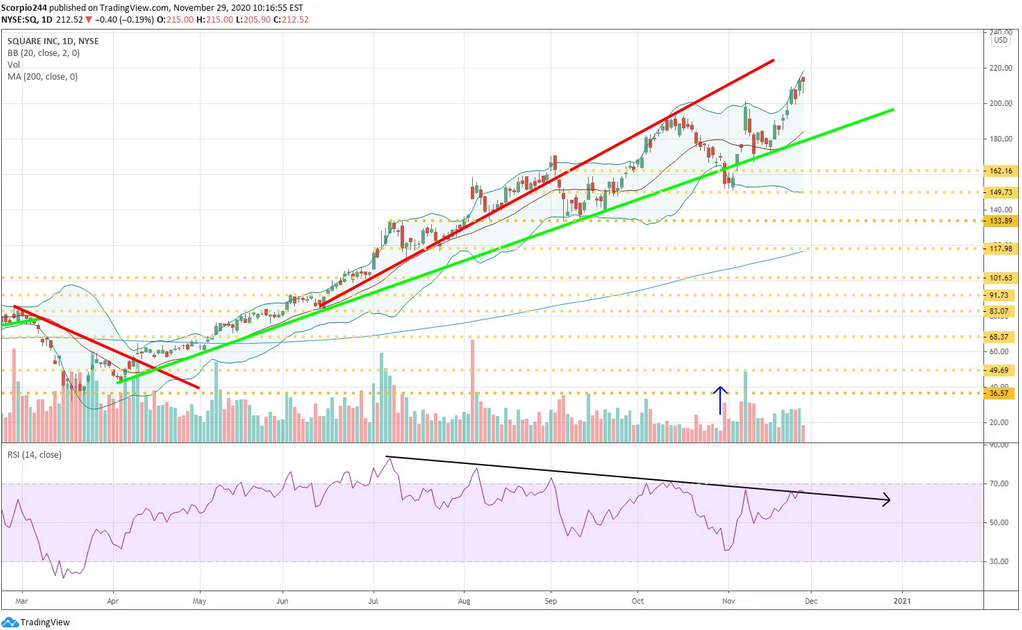
Square (NYSE:SQ)’s valuation is beyond inflated. I ran through all the metrics this week. I don’t know when it will deflate, but it will. I understand the game very well, but the amount of growth this stock will need over the next couple of years to make its valuation justifiable doesn’t even seem remotely reasonable. It has a PEG ratio of 4.5 for 2022. I think it pulls back to the 20-day moving average around $185.
Zoom
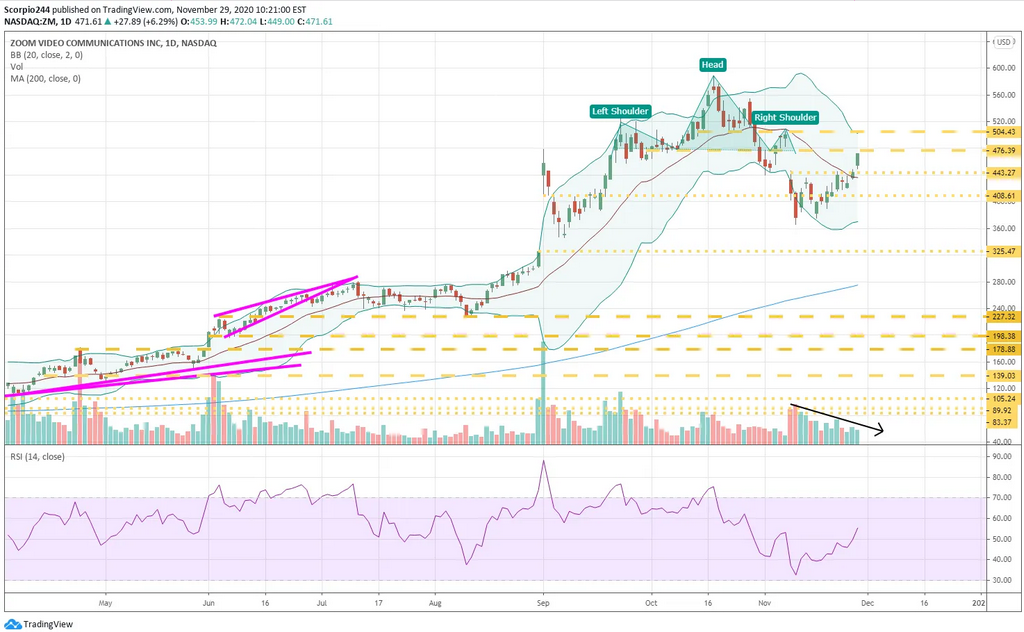
Zoom Video Communications (NASDAQ:ZM) is clearly in the process of filling the gap and retesting the bearish head and shoulders pattern. Between $475 and $505 is likely where this stock is heading over the very short-term, followed by a continuation of the previous trend, which is lower, and back towards $325.
The company reports this week too.
Apple
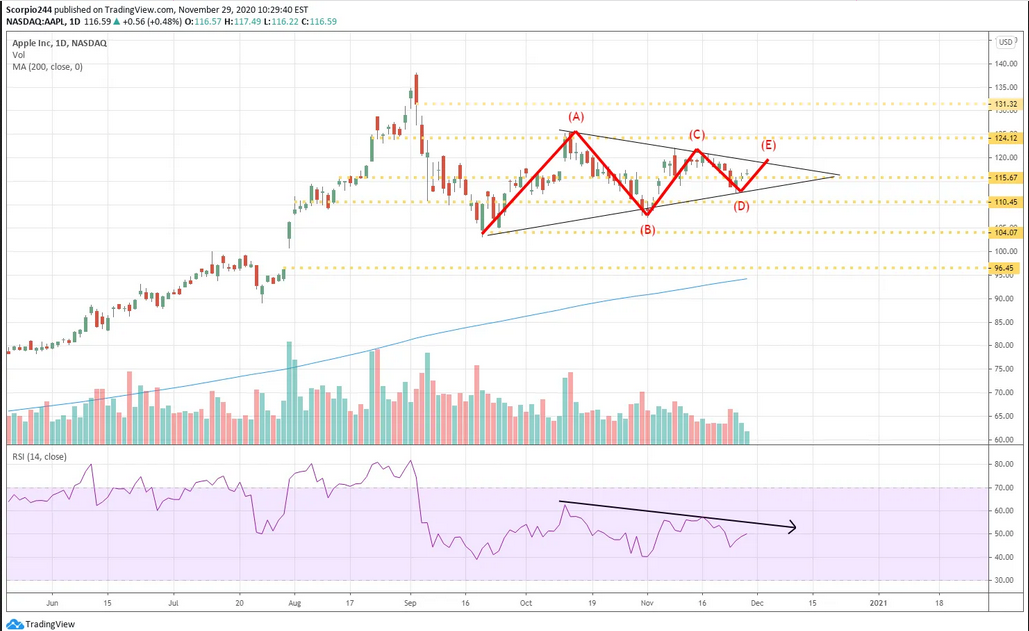
Apple (NASDAQ:AAPL) is consolidating in a symmetrical triangle, and that is a consolidation pattern. Volume and the RSI are both falling and suggesting that the stock is losing all of its buying momentum. It likely means the stock will break lower, probably not this week, but over the next few weeks, which likely puts it on a course to $104.
