Stocks erased their weekly gains and bond yields fell on Friday as investors reacted to a number of economic developments. Chief among them were a Treasury yield curve inversion, the first since before the financial crisis, and continued slowdown in the pace of U.S. manufacturing expansion.
I had my eye on several other market-moving news items, some of which I share with you below.
1. Palladium in Overbought Territory
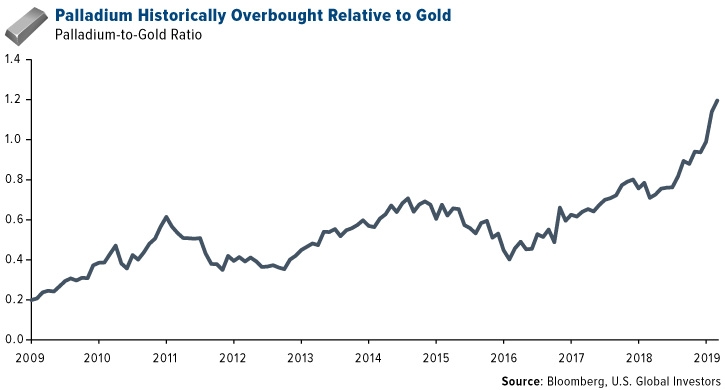
The price of palladium briefly topped $1,600 an ounce for the first time ever last week on a widening supply-demand imbalance. Markets sent the metal higher on news that Russia, the world’s number one producer of palladium, was set to ban the export of scrap metal, which would have the effect of squeezing global supply even further. This comes a week after car manufacturers signaled an increase in demand for palladium, which is used in the production of pollution-scrubbing catalytic converters.
As such, the palladium-to-gold ratio—or the measure of how many ounces of gold can be purchased with one ounce of palladium—is now at an historical high.
2. Nickel Also Performing Well on Supply Deficit Concerns
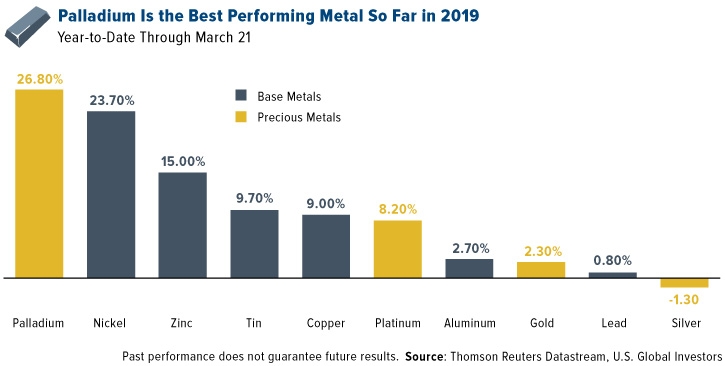
Palladium is the best performing metal so far in 2019, up nearly 27 percent. In second place is nickel, which is facing supply issues of its own. Global demand for nickel in 2019 is estimated at around 2.4 million metric tons, two thirds of which will be processed in stainless steel mills, mostly in China, according to Reuters.
3. Markets Grapple With First Yield Inversion Since Before the Financial Crisis
The yield on the 10-year Treasury fell to a more-than-one-year low last week on a dovish Federal Reserve. Fed Chair Jerome Powell indicated that interest rates were likely to stay unchanged throughout 2019 as officials assess the impact of a potential global economic slowdown. “Just as strong global growth was a tailwind,” Powell said, “weaker global growth can be a headwind to our economy.”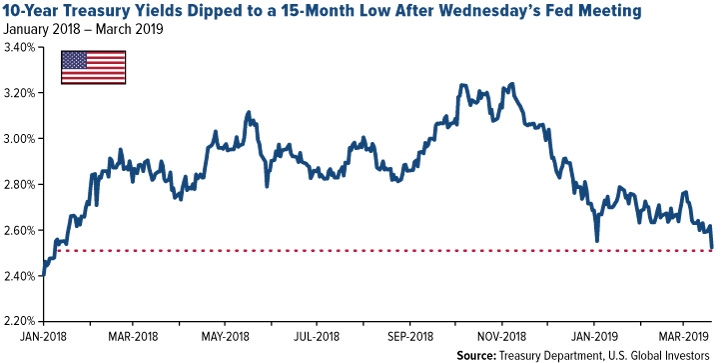
On Friday, the yield curve between the three-month and 10-year yield inverted, or turned negative, for the first time since before the financial crisis. Although past performance does not guarantee future results, it’s worth noting that such an inversion has preceded every U.S. recession over the last 60 years.
4. Traders Don’t See Rates Changing
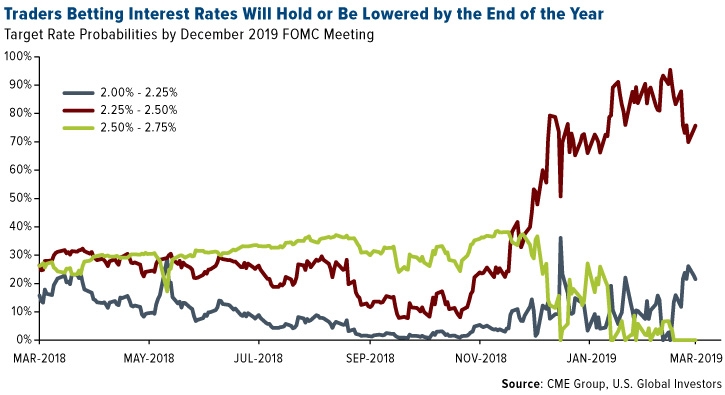
Even before Wednesday’s Fed announcement, a surging number of futures traders were betting that rates would stay unchanged, or even be lowered, between now and the end of 2019. Three quarters of traders this month were positive that rates would stay pat in the 2.25 percent to 2.50 percent range, up sharply from 26 percent of traders 12 months earlier, according to the CME Group’s FedWatch Tool. The probability that rates will be hiked by the end of the year are now at 0 percent.
5. Pace of Manufacturing Growth Continues to Slow
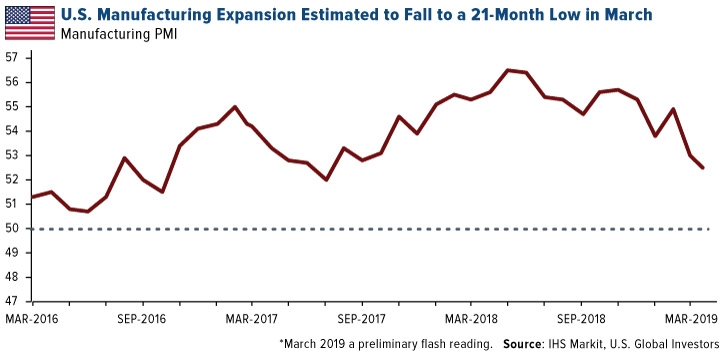
The preliminary U.S. purchasing manager’s index (PMI), released on Friday, shows manufacturing growth slowing to a 21-month low, from 53 in February to 52.5 in March. “Softer business activity growth reflected more subdued demand conditions in March, with new work rising at the weakest pace since April 2017,” the IHS Markit report reads.
6. A “Substantial” Amount of Tariffs
Markets also appear to be coming to terms with the realization that tariffs could be the norm for a lot longer than anticipated. Last week President Donald Trump said that the U.S. would keep trade barriers on China-made imports in place for a “substantial period of time”—even after a deal is eventually reached.
The U.S. currently has tariffs on approximately $265 billion worth of Chinese goods. This resulted in an eye-opening $2.7 billion tax increase on American businesses in November 2018 alone, according to Census Bureau data. Companies, as you might expect, have largely passed these extra costs on to consumers.
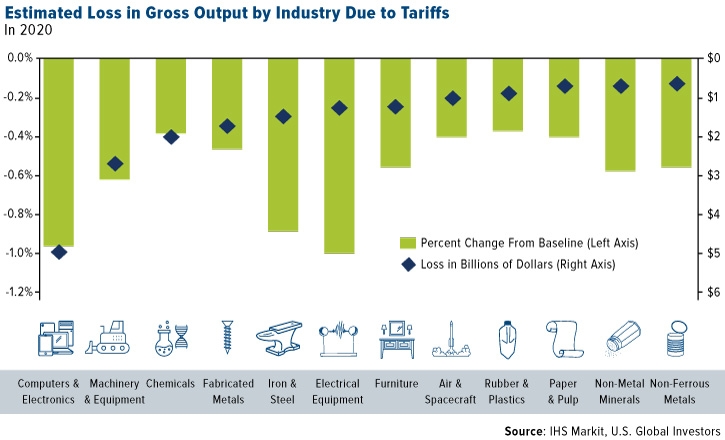
And then there’s lost export revenue and jobs to consider. According to a report this month by IHS Markit, tariffs are estimated to have a negative impact on the U.S. economy over the next 10 years. Ramifications include suppression of hundreds of thousands of American jobs, a dramatic reduction in consumers’ real spending power and a loss in gross output in a number of industries.
7. Fed Decides the Government Shutdown Wasn’t as Bad as All That
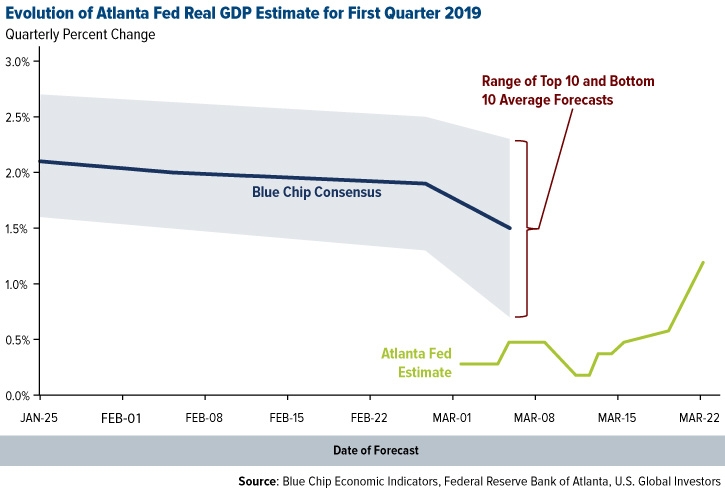
The good news is that on Friday the Atlanta Fed revised up its estimate for real U.S. gross domestic product (GDP) growth in the first quarter. It now stands at 1.2 percent quarter-over-quarter, up from an anemic 0.4 percent on March 13.
The new estimate still trails the Blue Chip consensus of top U.S. business economists. But it appears that Fed policymakers have determined that the government shutdown between December 22 and January 25 didn’t impact the U.S. economy as negatively as previously thought.
--
All opinions expressed and data provided are subject to change without notice. Some of these opinions may not be appropriate to every investor. By clicking the link(s) above, you will be directed to a third-party website(s). U.S. Global Investors does not endorse all information supplied by this/these website(s) and is not responsible for its/their content.
The Purchasing Manager’s Index is an indicator of the economic health of the manufacturing sector. The PMI index is based on five major indicators: new orders, inventory levels, production, supplier deliveries and the employment environment.
U.S. Global Investors, Inc. is an investment adviser registered with the Securities and Exchange Commission ("SEC"). This does not mean that we are sponsored, recommended, or approved by the SEC, or that our abilities or qualifications in any respect have been passed upon by the SEC or any officer of the SEC.
This commentary should not be considered a solicitation or offering of any investment product.
Certain materials in this commentary may contain dated information. The information provided was current at the time of publication.
- English (UK)
- English (India)
- English (Canada)
- English (Australia)
- English (South Africa)
- English (Philippines)
- English (Nigeria)
- Deutsch
- Español (España)
- Español (México)
- Français
- Italiano
- Nederlands
- Português (Portugal)
- Polski
- Português (Brasil)
- Русский
- Türkçe
- العربية
- Ελληνικά
- Svenska
- Suomi
- עברית
- 日本語
- 한국어
- 简体中文
- 繁體中文
- Bahasa Indonesia
- Bahasa Melayu
- ไทย
- Tiếng Việt
- हिंदी
7 Market-Moving Charts Investors Need to See
Published 03/25/2019, 02:29 PM
Updated 07/09/2023, 06:31 AM
7 Market-Moving Charts Investors Need to See
Latest comments
Install Our App
Risk Disclosure: Trading in financial instruments and/or cryptocurrencies involves high risks including the risk of losing some, or all, of your investment amount, and may not be suitable for all investors. Prices of cryptocurrencies are extremely volatile and may be affected by external factors such as financial, regulatory or political events. Trading on margin increases the financial risks.
Before deciding to trade in financial instrument or cryptocurrencies you should be fully informed of the risks and costs associated with trading the financial markets, carefully consider your investment objectives, level of experience, and risk appetite, and seek professional advice where needed.
Fusion Media would like to remind you that the data contained in this website is not necessarily real-time nor accurate. The data and prices on the website are not necessarily provided by any market or exchange, but may be provided by market makers, and so prices may not be accurate and may differ from the actual price at any given market, meaning prices are indicative and not appropriate for trading purposes. Fusion Media and any provider of the data contained in this website will not accept liability for any loss or damage as a result of your trading, or your reliance on the information contained within this website.
It is prohibited to use, store, reproduce, display, modify, transmit or distribute the data contained in this website without the explicit prior written permission of Fusion Media and/or the data provider. All intellectual property rights are reserved by the providers and/or the exchange providing the data contained in this website.
Fusion Media may be compensated by the advertisers that appear on the website, based on your interaction with the advertisements or advertisers.
© 2007-2024 - Fusion Media Limited. All Rights Reserved.

