Get 40% Off
🚨 Volatile Markets? Find Hidden Gems for Serious OutperformanceFind Stocks Now

6 Monster Stock Market Predictions For The Week Ahead

Published 06/15/2020, 02:54 AM
Updated 09/20/2023, 06:34 AM

It will be another busy week for stocks with Powell slated to speak before congress on Tuesday and again on Wednesday. We will get some regional Fed data, the Germany ZEW survey, and the weekly jobless claims.

It will be important for the S&P 500 to hold 3,000 to start the week because if the index breaks 3,000 early in the week, it could put a lot of pressure on equities for the entire week. Should the index break 2,950, things could get tricky and result in a fast drop to around 2,860.
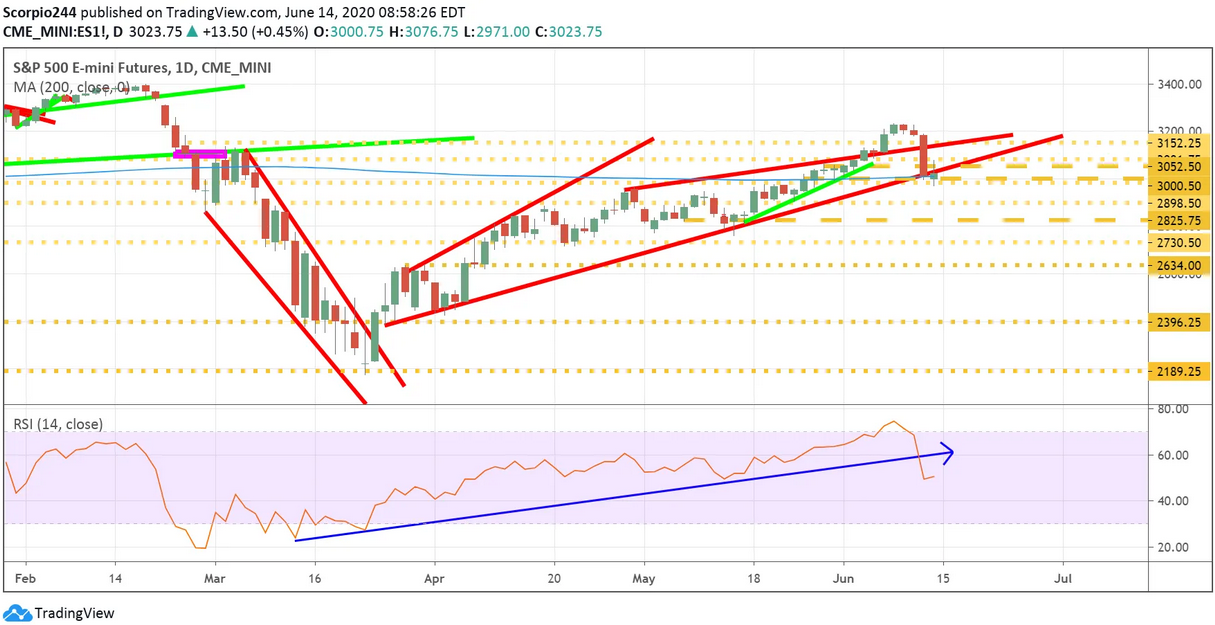
S&P 500 Emini Futures Daily Chart

This week is also options expiration, and the significant open interest levels are at 2,800, 2,900, and 3,000. These significant open interest levels could act as magnets this week, should the markets begin to move lower. Open interest levels thin out after the 3,000 strike price.
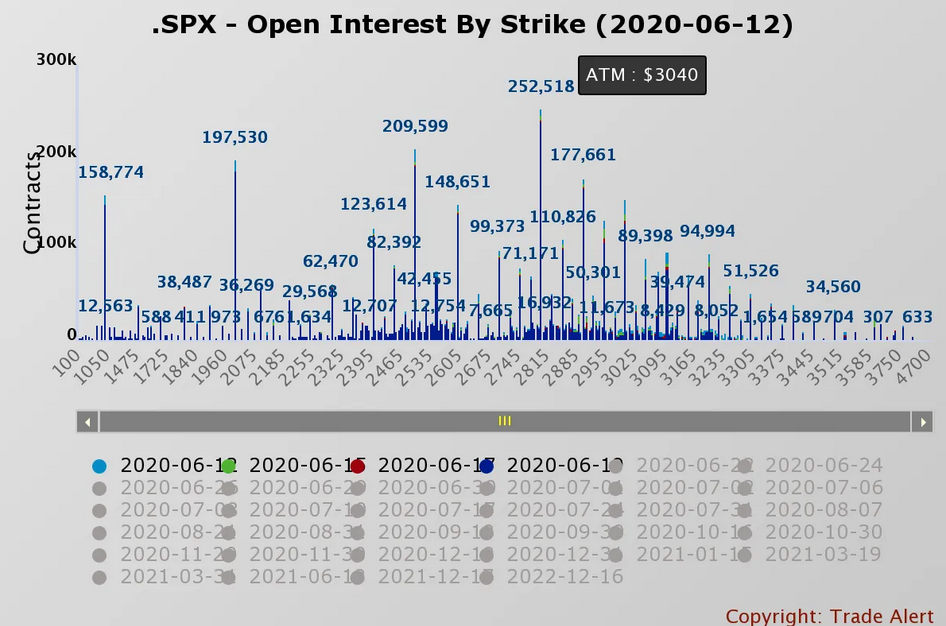
SPX Open Interest By Strike

Disney

Disney broke an uptrend, and I still happen to think investors are underestimating the potential damage that is beginning inflicted on Disney, and that the stock has further to fall. The next significant level of support for the stock comes around $109.
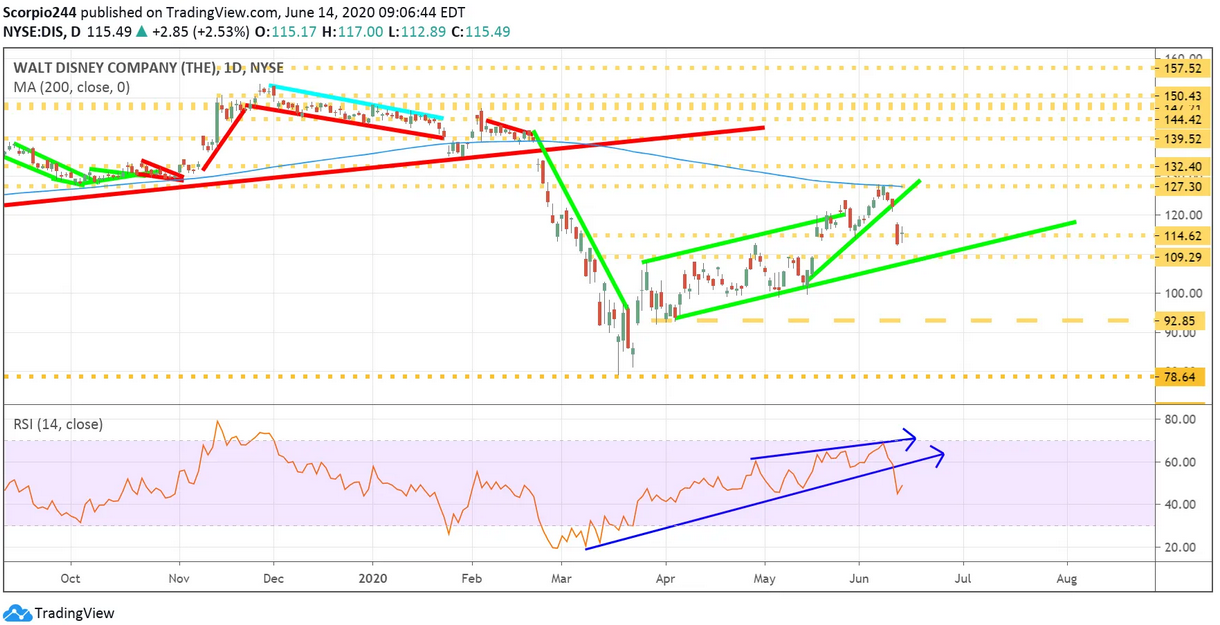
Walt Disney Daily Chart

Alphabet

Alphabet (NASDAQ:GOOGL) broke the uptrend, and now $1,430 is acting as resistance. The uptrend in the RSI is broken, and that suggests the stock move lowers towards support at $1360.
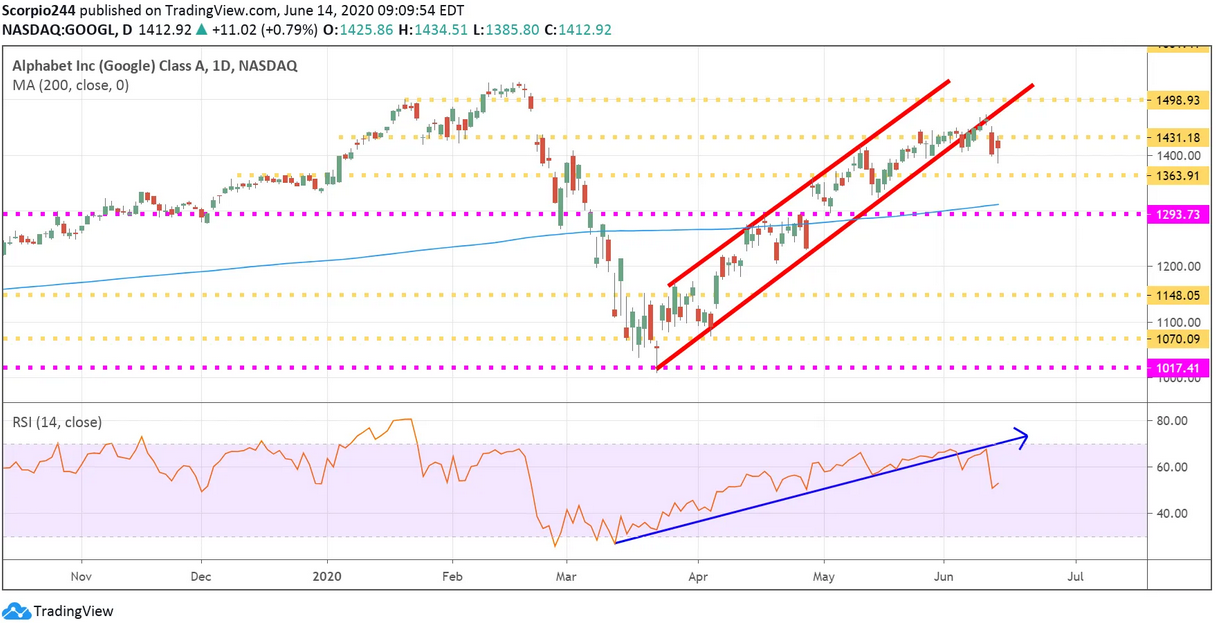
Google Inc Daily Chart

Square

Square tested and held the uptrend this week, but the RSI is now moving lower, and that suggests the stock breaks the uptrend and moves lower to $79.
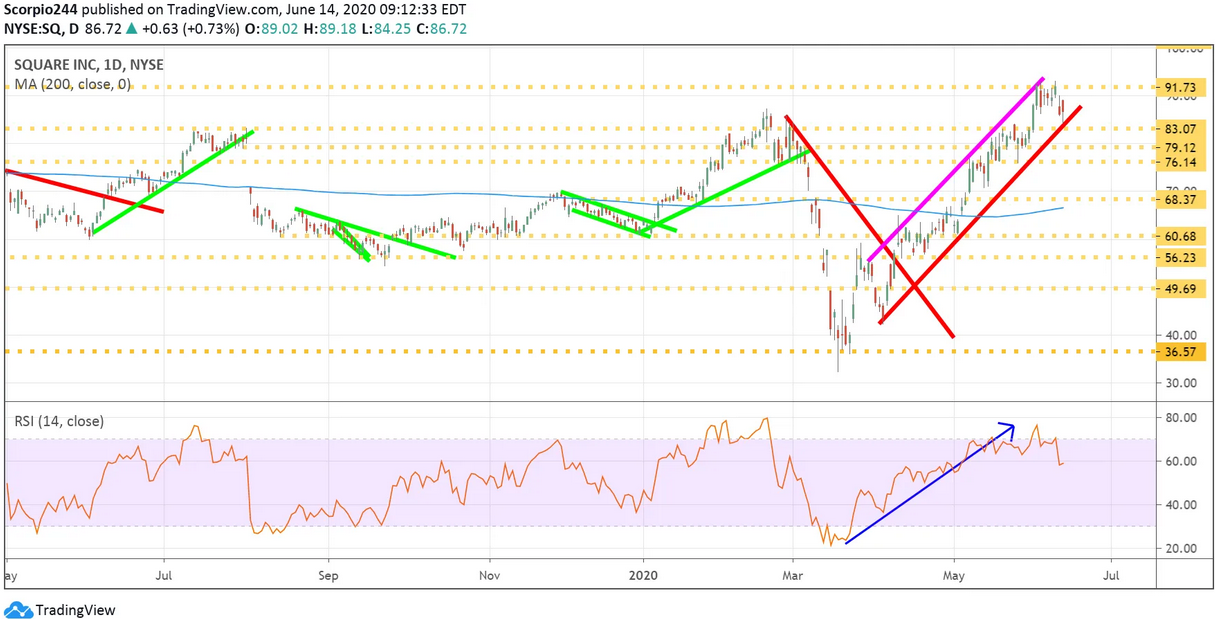
Square Inc Daily Chart

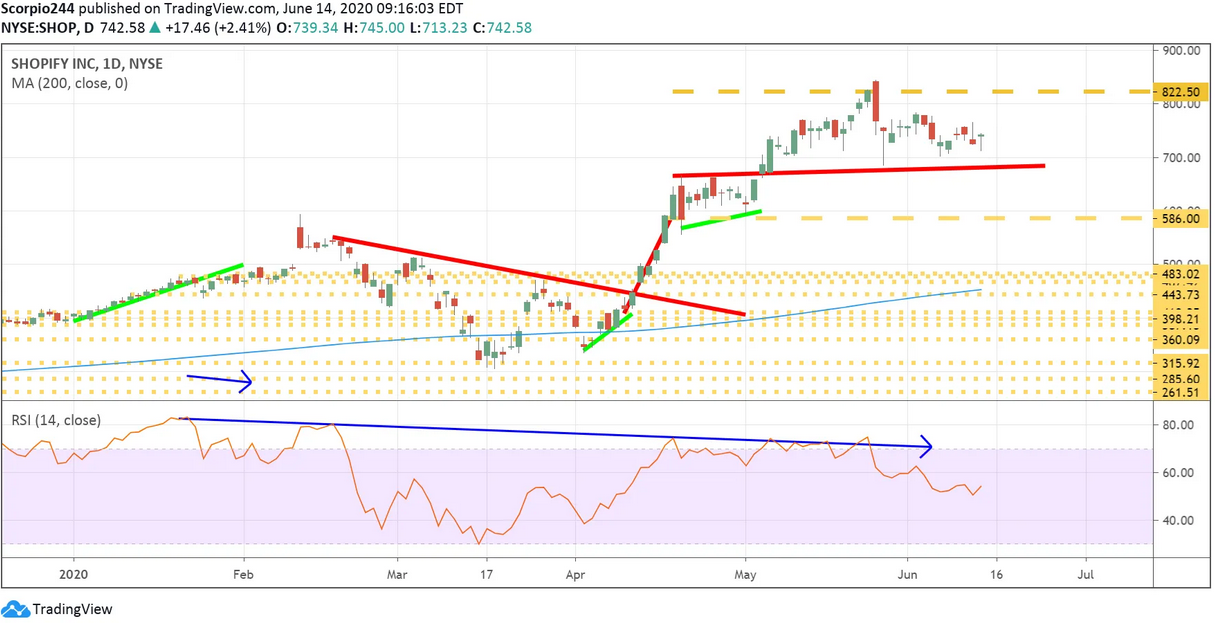
Shopify

Shopify (NYSE:SHOP) has been losing a lot of momentum in recent days, with an RSI that is steadily trending lower. All it will take is a break of support around $675 to push shares back to $590.
3rd party Ad. Not an offer or recommendation by Investing.com. See disclosure here or remove ads .

Shopify Inc Daily Chart

Intel

Intel (NASDAQ:INTC) broke its uptrend on the RSI and couldn’t get back above $59.75 last week. It probably means it continues lower towards $55.90.
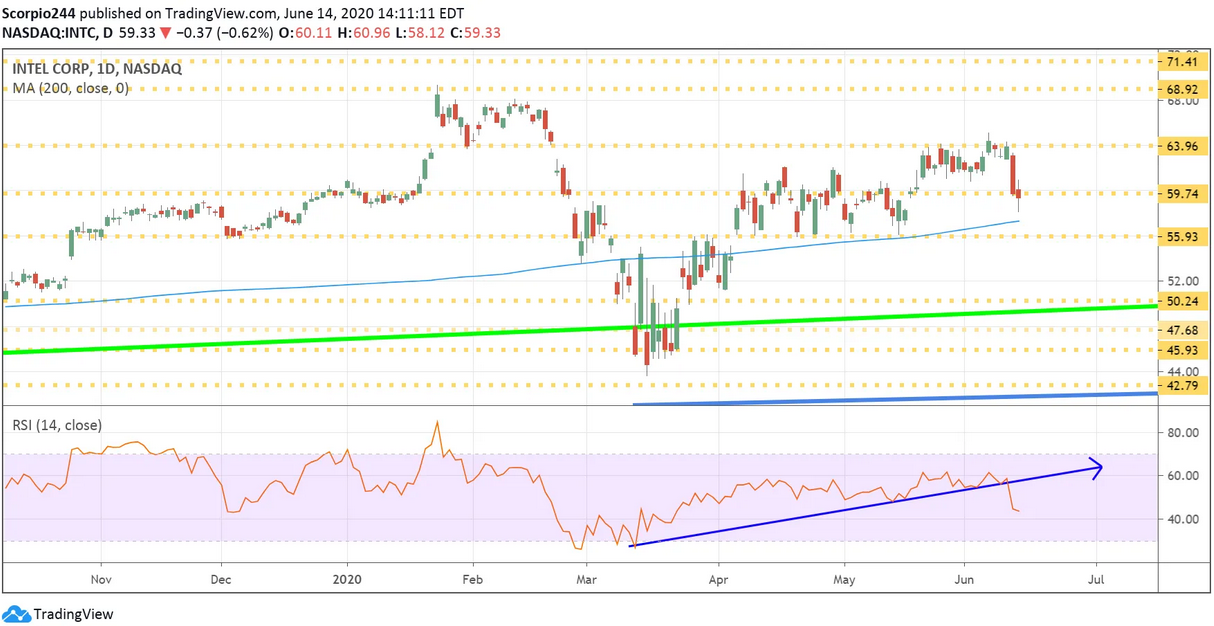
Intel Corp Daily Chart

Original Post

Latest comments

Michael, your articles seem to post several hours after you write them. Can you get them posted closer to real time?
Risk Disclosure: Trading in financial instruments and/or cryptocurrencies involves high risks including the risk of losing some, or all, of your investment amount, and may not be suitable for all investors. Prices of cryptocurrencies are extremely volatile and may be affected by external factors such as financial, regulatory or political events. Trading on margin increases the financial risks.
Before deciding to trade in financial instrument or cryptocurrencies you should be fully informed of the risks and costs associated with trading the financial markets, carefully consider your investment objectives, level of experience, and risk appetite, and seek professional advice where needed.
Fusion Media would like to remind you that the data contained in this website is not necessarily real-time nor accurate. The data and prices on the website are not necessarily provided by any market or exchange, but may be provided by market makers, and so prices may not be accurate and may differ from the actual price at any given market, meaning prices are indicative and not appropriate for trading purposes. Fusion Media and any provider of the data contained in this website will not accept liability for any loss or damage as a result of your trading, or your reliance on the information contained within this website.
It is prohibited to use, store, reproduce, display, modify, transmit or distribute the data contained in this website without the explicit prior written permission of Fusion Media and/or the data provider. All intellectual property rights are reserved by the providers and/or the exchange providing the data contained in this website.
Fusion Media may be compensated by the advertisers that appear on the website, based on your interaction with the advertisements or advertisers.
© 2007-2024 - Fusion Media Limited. All Rights Reserved.