Last week was another up week for stocks, but that may be it for the time being. With minimal economic data coming this week, options expiration behind us, and earnings season kicking into high gear, it means the focus will shift to earnings results and perhaps more important, guidance going forward.
The first two weeks of April have been dominated by investors flooding into the big mega-cap technology sector again. Everything seemed to change on Mar. 26, when we got that big move higher in the final two hours of trading. Of course, that was the day we found out about Archegos Capital and the blocks of stock that were coming for sale.
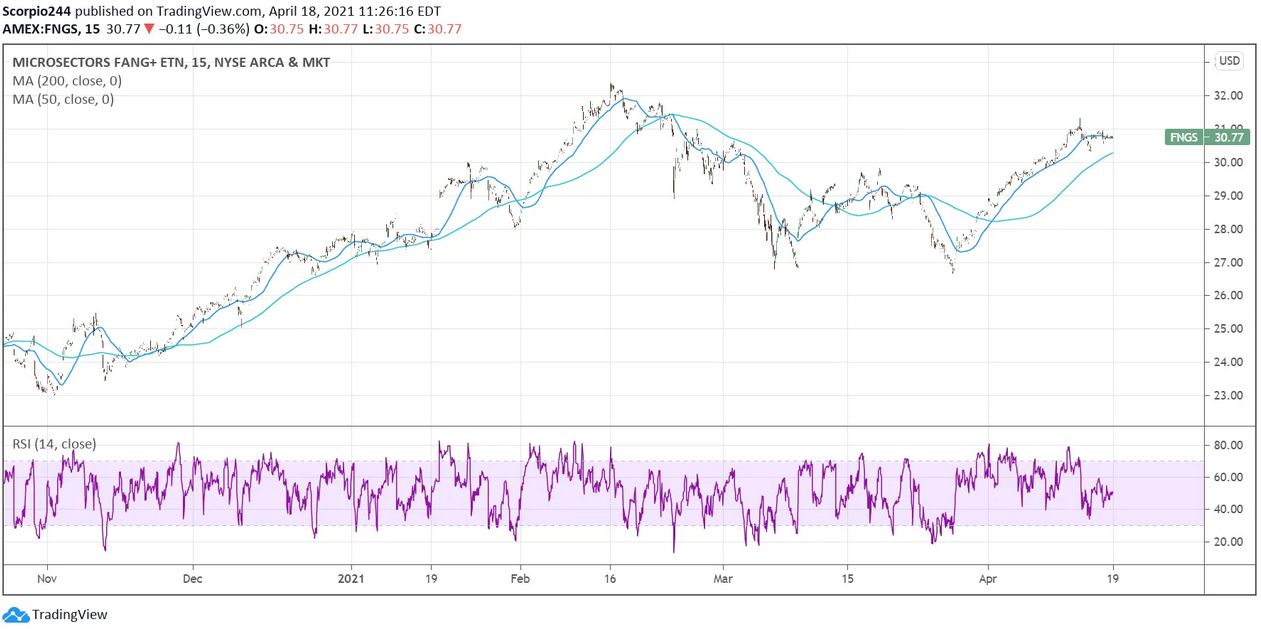
Over that time, stocks like Amazon, Nvidia, Tesla, Apple, and all the mega technology stocks exploded higher, in many cases by more than 10%. The MicroSectors™ FANG+™ ETN (NYSE:FNGS) has risen by more than 15% since that time.
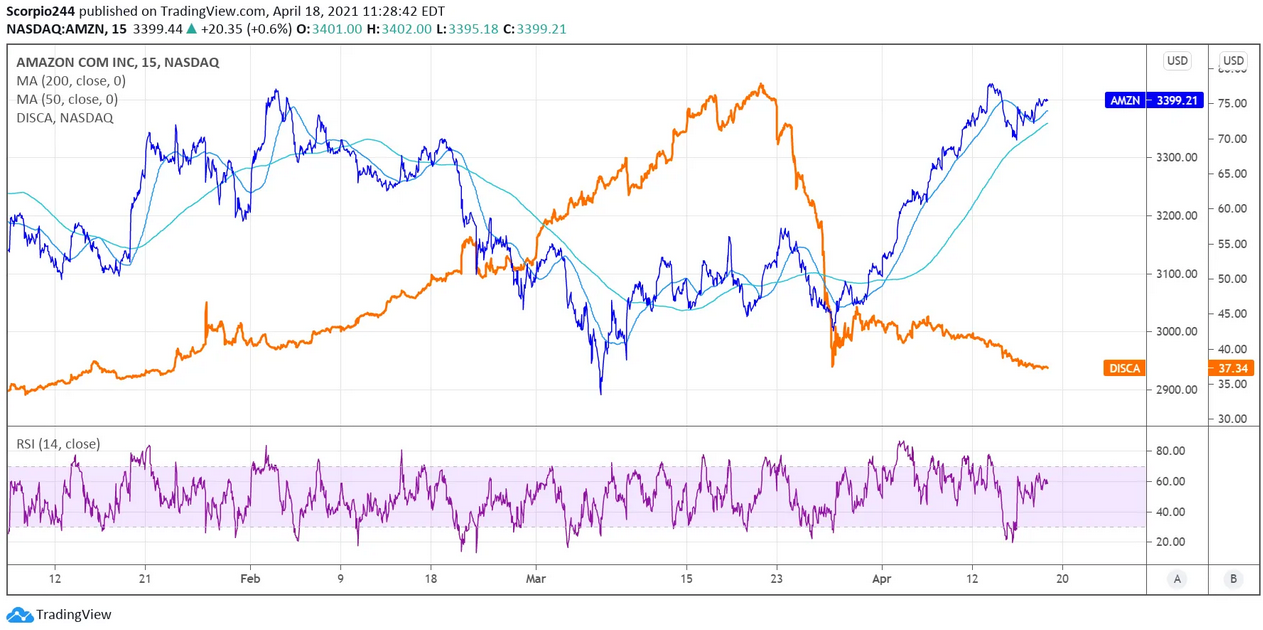
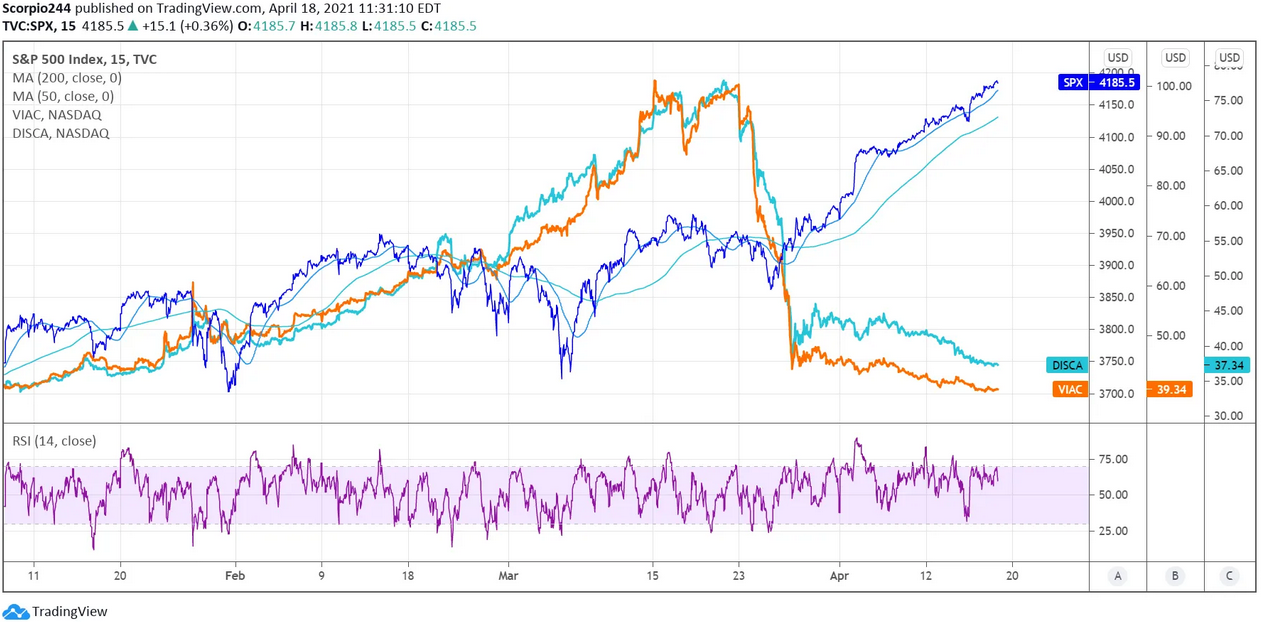
Perhaps, when unwinding stocks like Viacom (NASDAQ:VIAC) and Discovery (NASDAQ:DISCA), many of these investment banks decided to reallocate the dollars into the safety trade of Big Technology. It is possible; the price action would suggest that happen.
Since the S&P 500 is heavily weighted toward the mega-caps, the S&P 500 has taken off as well, sending the index surging higher.
1. S&P 500
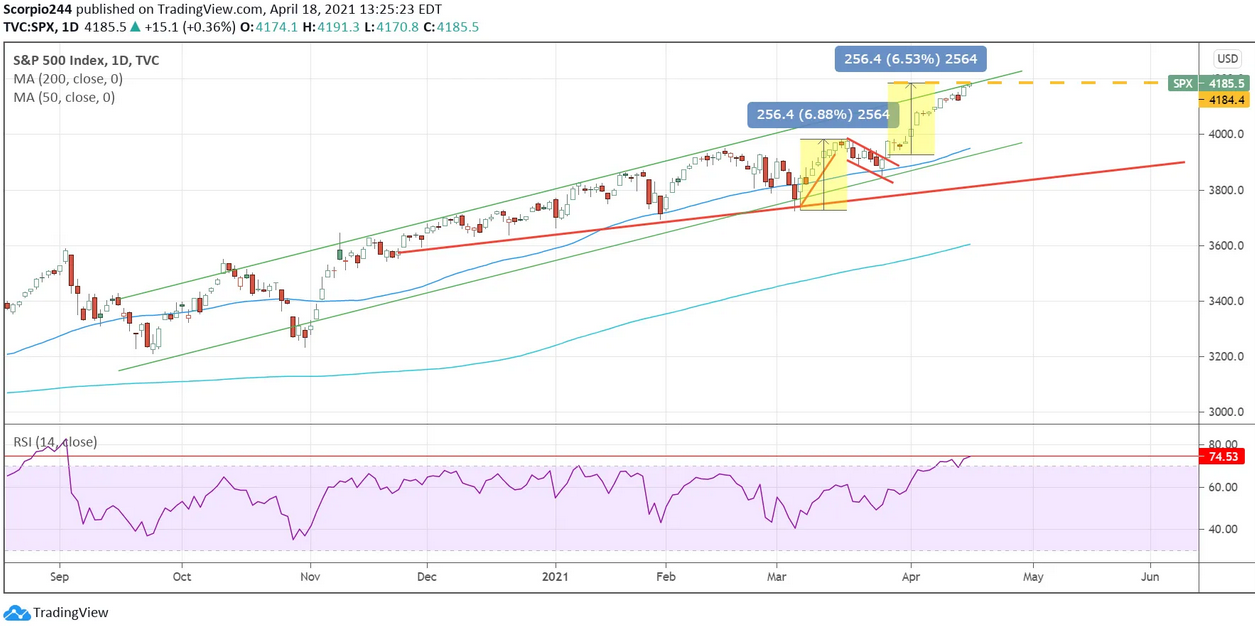
The S&P 500 (SPY) did finish the week trading around 4,185, which is the upper end of the trend line, while the RSI is overbought. It should lead to a reversal of trend, and that move lower towards 3,960 I have been plotting out for the last few trading sessions.
2. Amazon
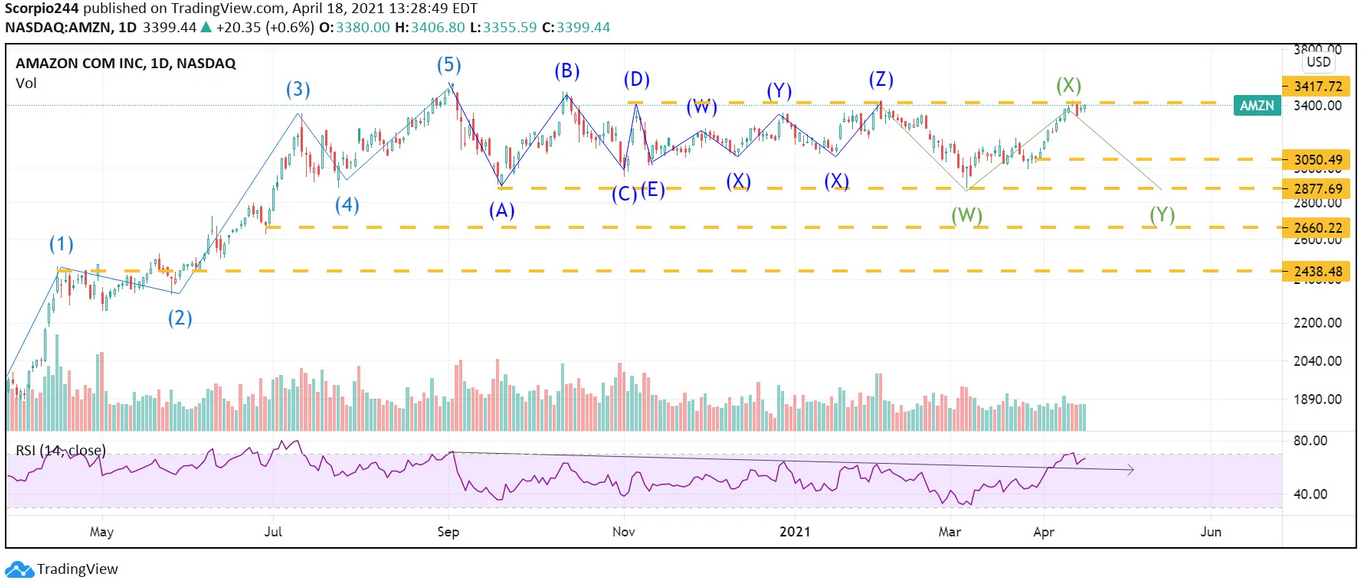
Meanwhile, Amazon (NASDAQ:AMZN) hit up against resistance at $3,420, which has been a potent level since September. There is a perfect chance the stock fails to advance and instead falls back to $3,050. It appears it may have just come too far, too fast, and now it may be overbought.
3. Nvidia
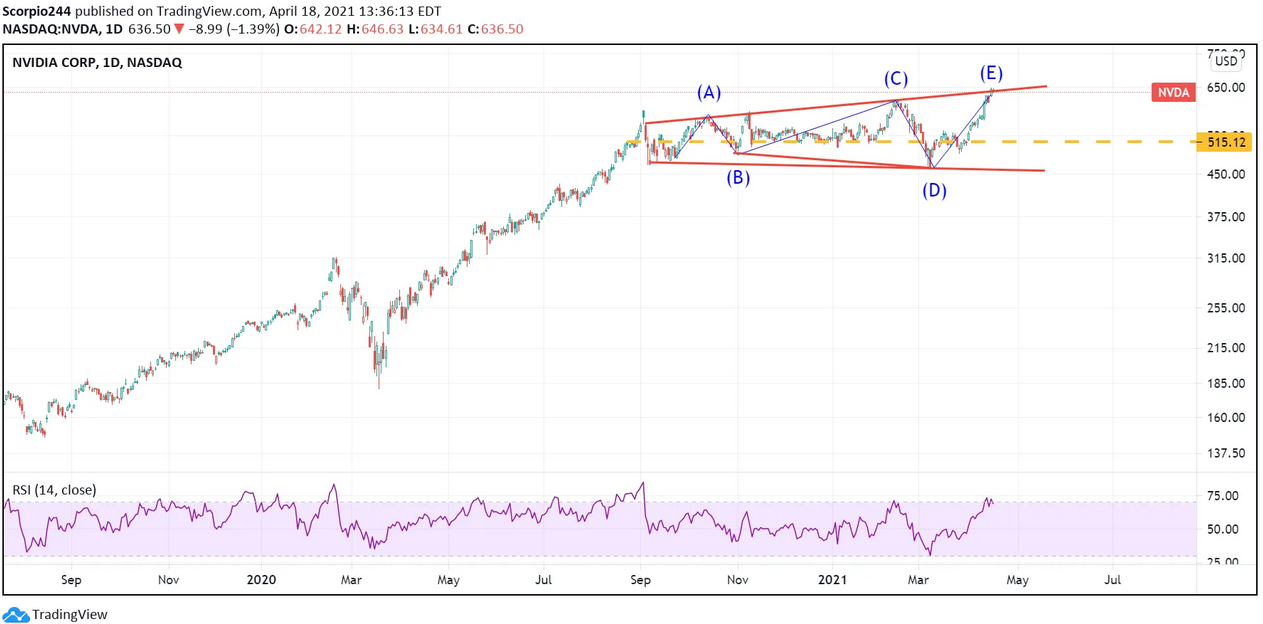
NVIDIA (NASDAQ:NVDA) is similar, rising very quickly, and also appears overbought. I always find broadening wedge to be difficult patterns, so I’m not sure which way the broadening wedge breaks longer-term. But at least in the short-term, there is a good chance the stock pushes lower towards $460 again.
4. Apple
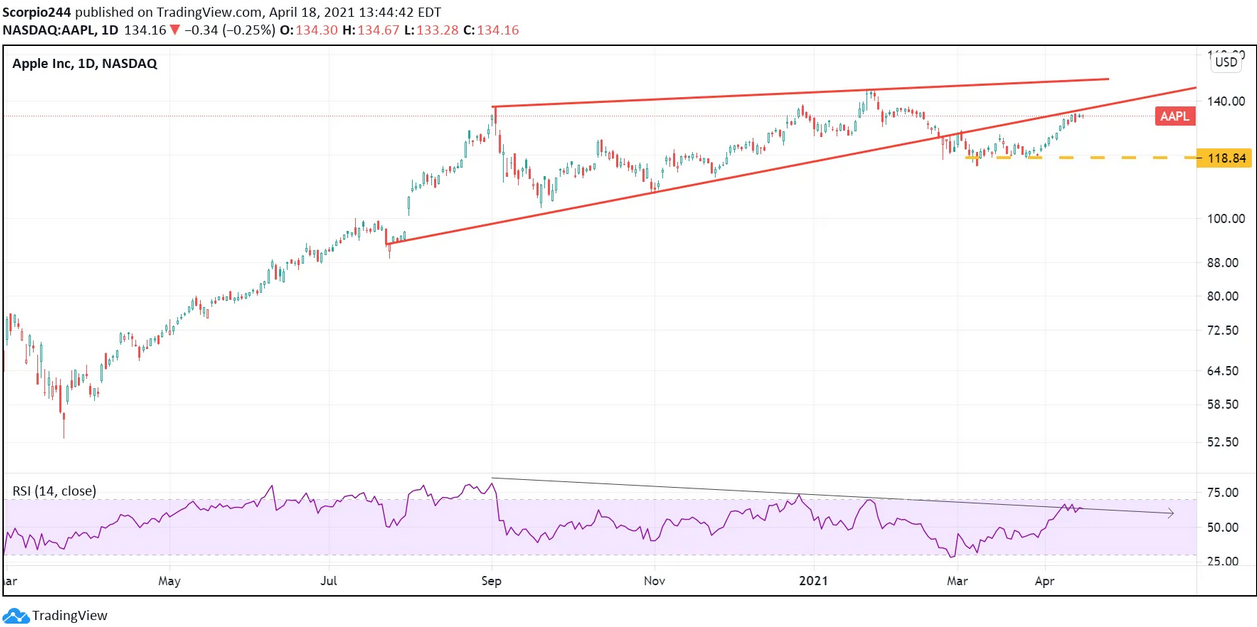
For Apple (NASDAQ:AAPL), we need to wonder if the recent move higher was just part of a retest of the breaking of the uptrend. At this point, it very much looks like that may be the case. If it is, then we should see the stock turn lower and head back to $120.
5. Bitcoin
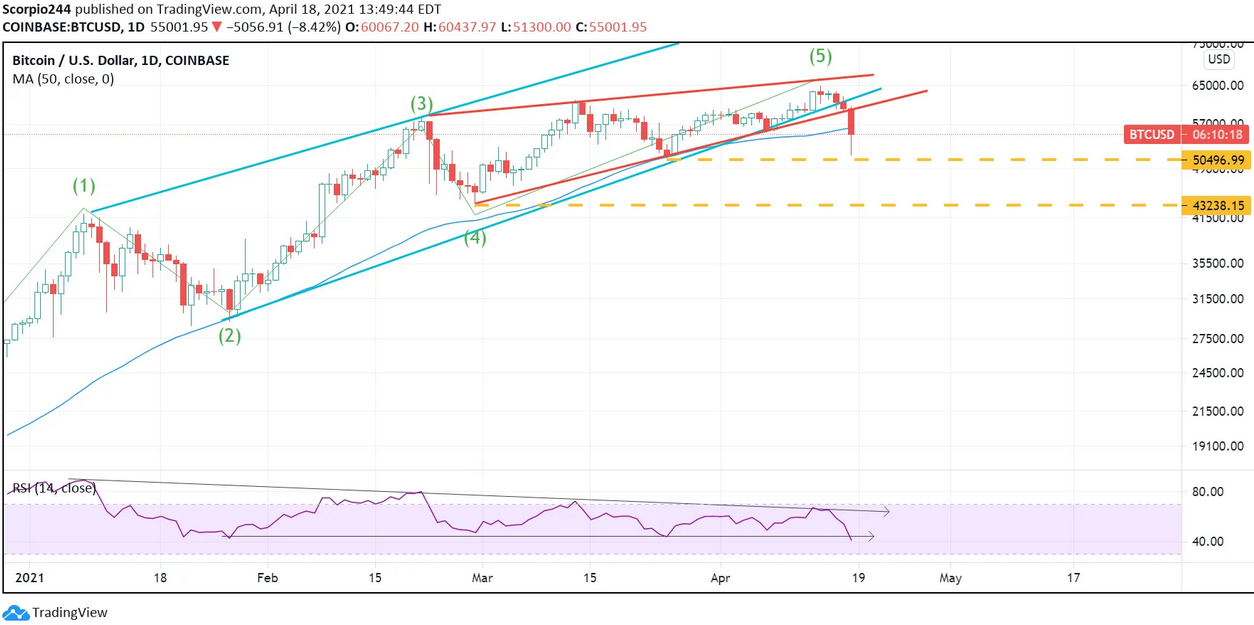
Bitcoin was trading down 8% Monday, and no matter how you draw it, the trend in Bitcoin is broken. Additionally, the 50-day moving average is now in jeopardy. If Bitcoin closes below the 50-day today, it likely sends a negative signal and potentially leads to Bitcoin testing support around 50,000. In this case, the rising wedge pattern I pointed out a few days ago is looking pretty scary.
6. Tesla
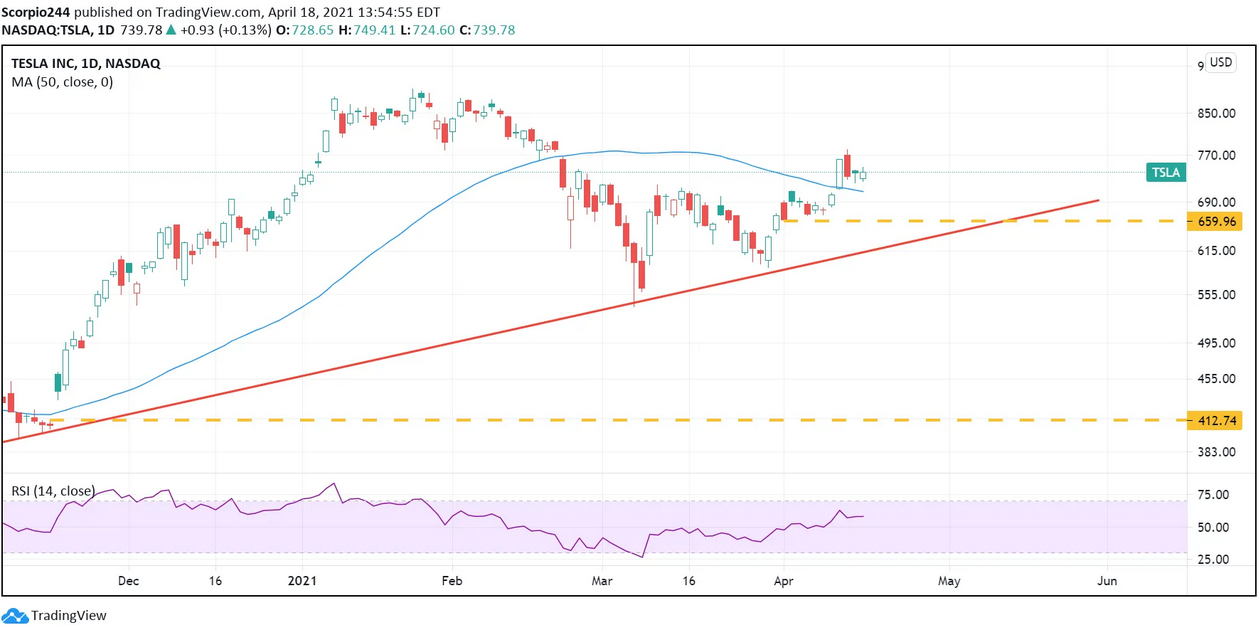
The problem is that now that Tesla (NASDAQ:TSLA) owns however many billions of dollars of Bitcoin, the stock will trade in sympathy with Bitcoin. So if Bitcoin continues lower, Tesla will go lower. Right now, the uptrend in Tesla should offer support of around $660.
