In the not too recent past, when people thought of technology stocks they were mainly focused on high growth. However, as technology has evolved and become more mainstream, so to have technology stocks. Today there are many technology stocks that are paying dividends, but best of all, not at the sacrifice of potential growth. This article looks at five technology stocks with yields equivalent to or greater than the 30-year Treasury bond, that offer above-average expected future growth while simultaneously available at very attractive valuations.
The following table summarizes five technology stocks with yields equivalent to or greater than the 30-year treasury bond that appear to be attractively valued, and lists them in order of Estimated Total Return from highest to lowest. From left to right, the table shows the company’s stock symbol and name. Next, two valuation metrics are listed side-by-side, the historical normal PE ratio followed by the current PE ratio for perspective. Then the company’s Estimated EPS growth, five-year estimated annual total return is shown next, and then the current dividend yield.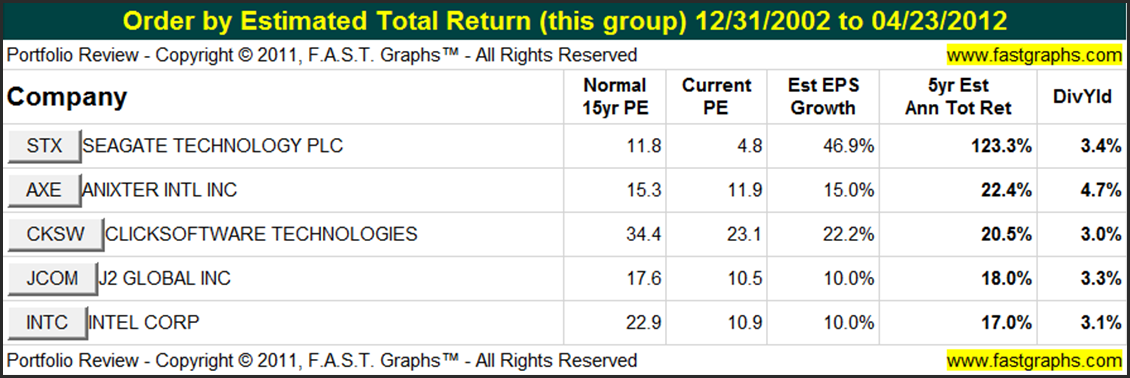
A Closer Look at the Past and the Future Potential
Since a picture is worth 1,000 words, we’ll take a closer look at the past performance and future potential of each of our five candidates through the lens of F.A.S.T. Graphs™.
Earnings Determine Market Price: The following earnings and price correlated historical graphs clearly illustrates the importance of earnings. The Earnings Growth Rate Line or True Worth™ Line (orange line with white triangles) is correlated with the historical stock price line. On graph after graph the lines will move in tandem. If the stock price strays away from the earnings line (over or under), inevitably it will come back to earnings. The historical normal PE ratio line (dark blue line with*) depicts a PE ratio that the market has historically applied.
The orange True Worth™ line and the blue normal PE ratio line provide perspectives on valuation. The orange line reflects the fair value of each company’s earnings relative to its growth rate achievement, and the blue line reflects how the market has traditionally valued the company’s stock relative to its fair value. The blue line represents a trimmed historical normal PE ratio (the highest and lowest PEs are trimmed). These lines should be viewed as barometers or aids for ascertaining sound buy, sell or hold decisions. Rather than seen as absolutes, they should be seen as guides to better thinking.
“Seagate is a worldwide leader in hard disk drives and storage solutions.” 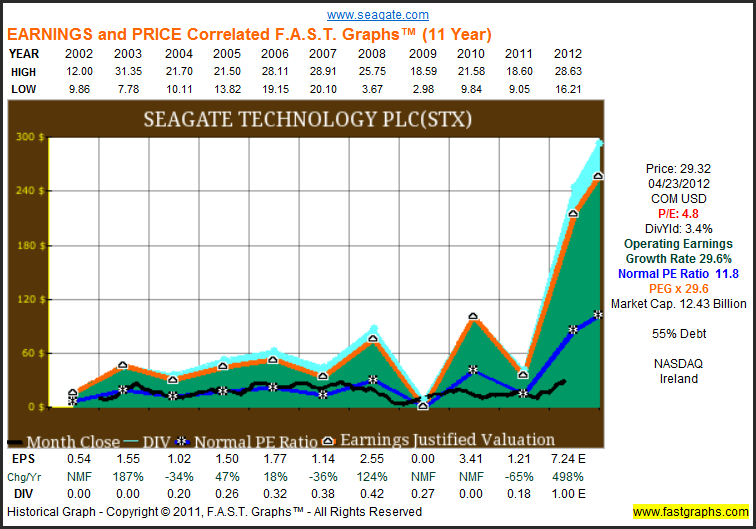
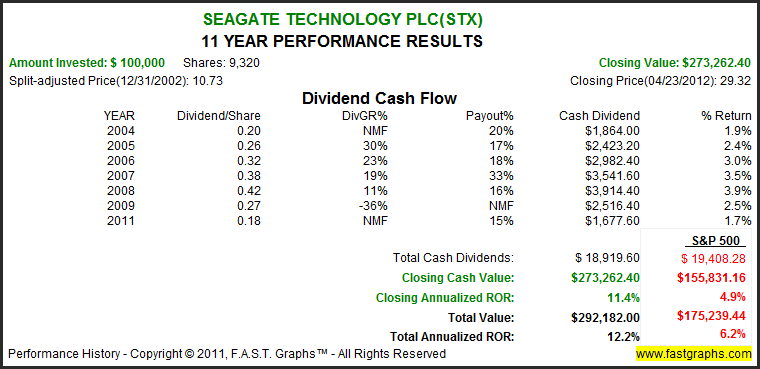
The consensus of 19 leading analysts reporting to Capital IQ forecast Seagate Technology’s long-term earnings growth at 46.9%. Seagate Technology has high long-term debt at 55% of capital. Seagate Technology is currently trading at a P/E of 4.8, which is below the value corridor (defined by the five orange lines) of a maximum P/E of 48. If the earnings materialize as forecast, Seagate Technology’s True Worth™ valuation would be $1874.32 at the end of 2017, which would be a 123.3% annual rate of return from the current price.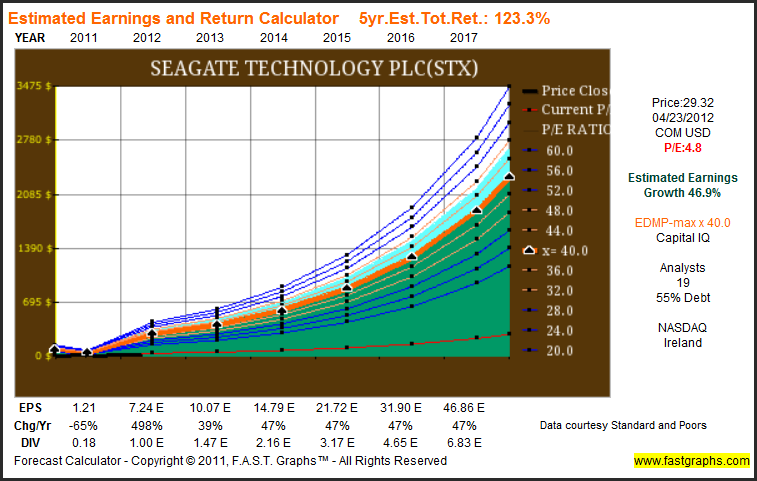
“Anixter International is a leading global distributor of communication and security products, electrical and electronic wire & cable, fasteners and other small parts. The company adds value to the distribution process by providing its customers access to 1) innovative inventory management programs, 2) more than 450,000 products and over $1 billion in inventory, 3) approximately 225 warehouses with 7 million square feet of space, and 4) locations in over 260 cities in more than 50 countries. Founded in 1957 and headquartered near Chicago, Anixter trades on the New York Stock Exchange under the symbol AXE.”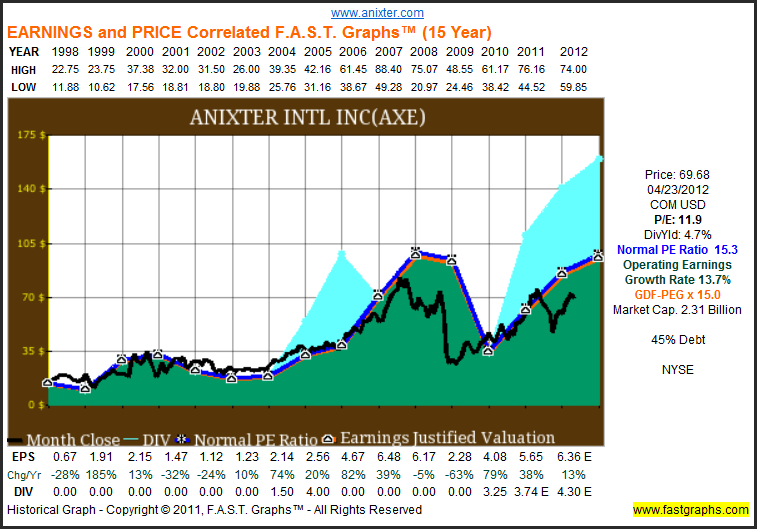
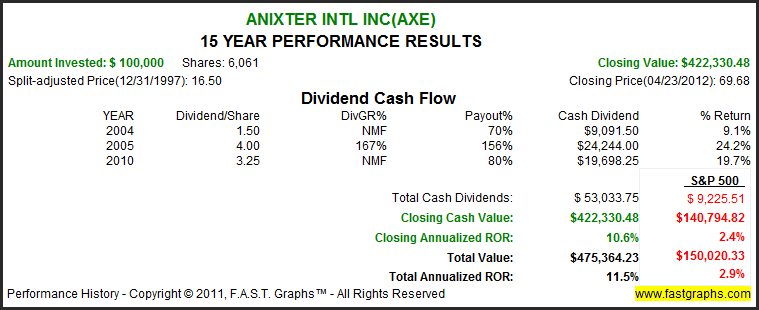
The consensus of 11 leading analysts reporting to Capital IQ forecast Anixter International Inc’s long-term earnings growth at 15%. Anixter International Inc has medium long-term debt at 45% of capital. Anixter International Inc is currently trading at a P/E of 11.9, which is below the value corridor (defined by the five orange lines) of a maximum P/E of 18. If the earnings materialize as forecast, Anixter International Inc’s True Worth™ valuation would be $182.33 at the end of 2017, which would be a 22.4% annual rate of return from the current price.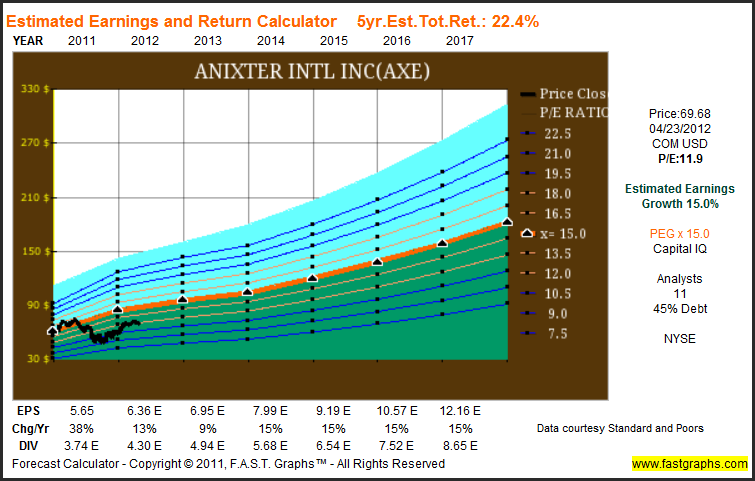
“ClickSoftware is the leading provider of automated workforce management and optimization solutions for every size of field service business. Its portfolio of solutions, available on demand and on premise, create business value through higher levels of productivity, customer satisfaction and operational efficiency. Its patented concept of 'continuous planning and scheduling' incorporates customer demand forecasting, long and short term capacity planning, shift planning, real-time service scheduling software, mobile workforce management , enterprise mobility, and location-based services, as well as on-going communication with the consumer on the expected arrival time of the service resource.” 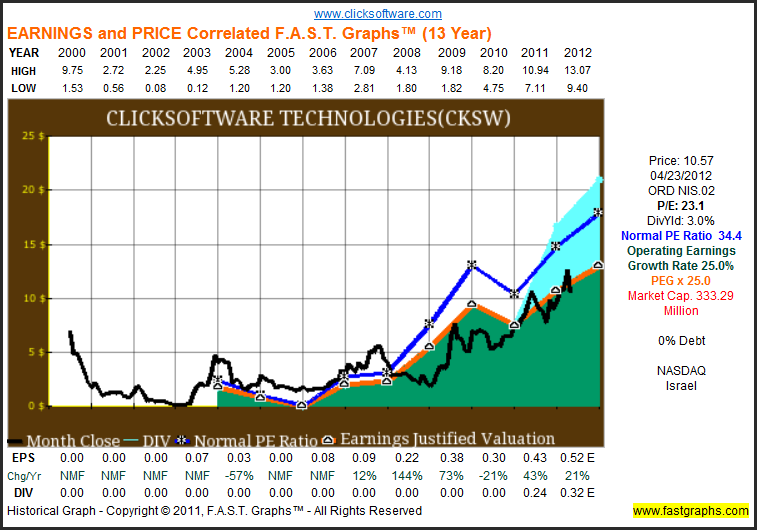
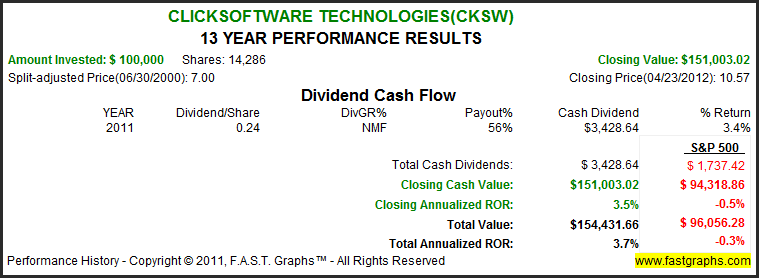
The consensus of 1 leading analyst reporting to Capital IQ forecast ClickSoftware Technologies’ long-term earnings growth at 22.2%. ClickSoftware Technologies has no debt. ClickSoftware Technologies is currently trading at a P/E of 23.1, which is inside the value corridor (defined by the five orange lines) of a maximum P/E of 26.6. If the earnings materialize as forecast, ClickSoftware Technologies’ True Worth™ valuation would be $27.23 at the end of 2017, which would be a 20.5% annual rate of return from the current price.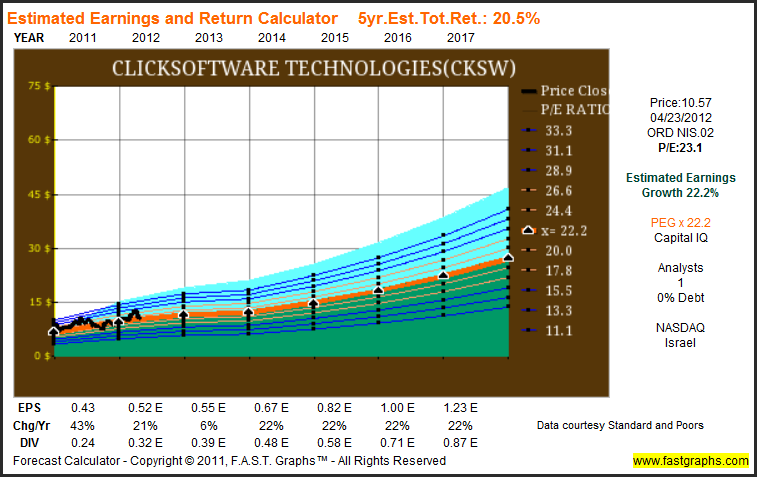
“j2 Global (NASDAQ: JCOM) provides cloud services for business, offering Internet fax, virtual phone, hosted email, email marketing, online backup, unified communications, and CRM solutions. Founded in 1995, the company's messaging network spans more than 49 countries on six continents. j2 Global markets its services principally under the brand names eFax®, eVoice®, FuseMail®, Campaigner®, KeepItSafe®, and Onebox®. As of December 31, 2011, j2 Global had achieved 16 consecutive fiscal years of revenue growth.”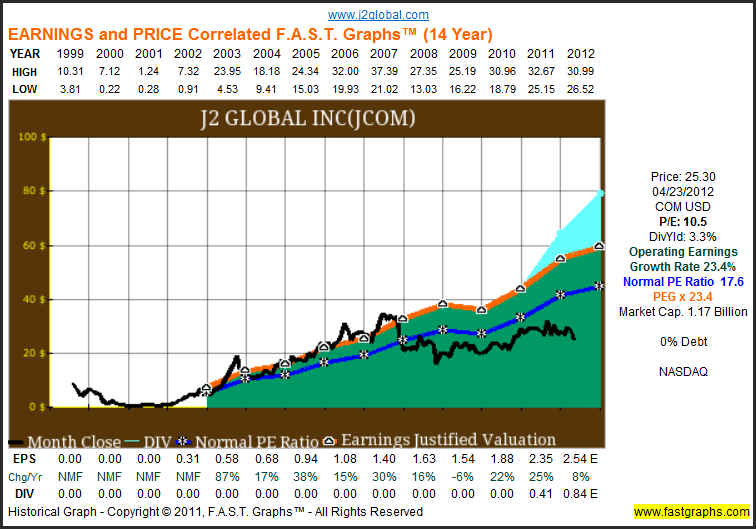
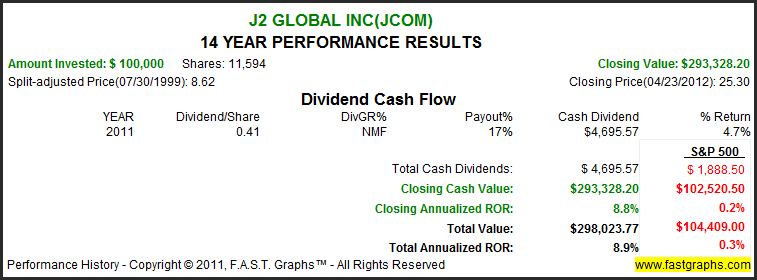
The consensus of 6 leading analysts reporting to Capital IQ forecast J2 Global Inc’s long-term earnings growth at 10%. J2 Global Inc has no debt. J2 Global Inc is currently trading at a P/E of 10.5, which is below the value corridor (defined by the five orange lines) of a maximum P/E of 18. If the earnings materialize as forecast, J2 Global Inc’s True Worth™ valuation would be $58.31 at the end of 2017, which would be a 18% annual rate of return from the current price.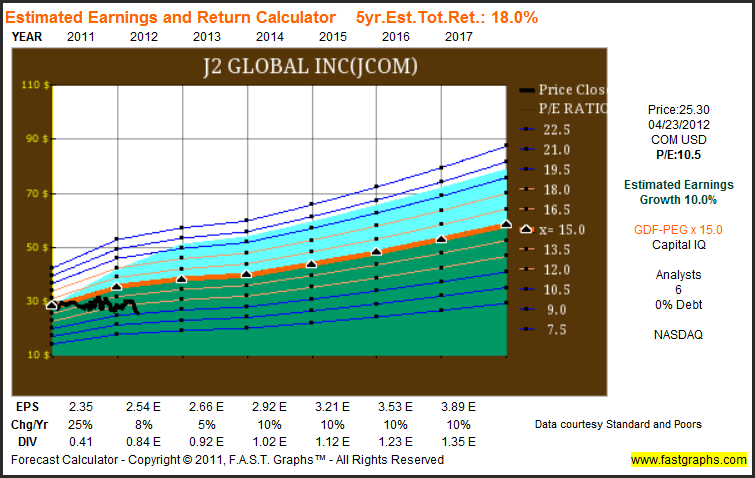
“Intel (NASDAQ: INTC) is a world leader in computing innovation. The company designs and builds the essential technologies that serve as the foundation for the world’s computing devices.” 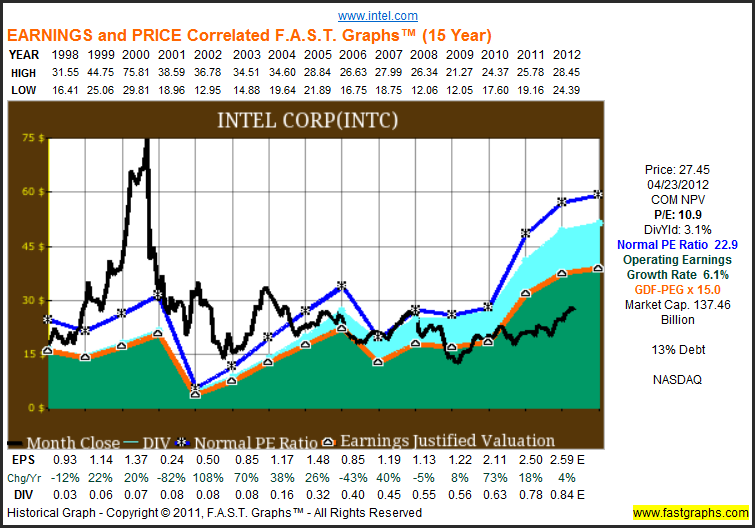
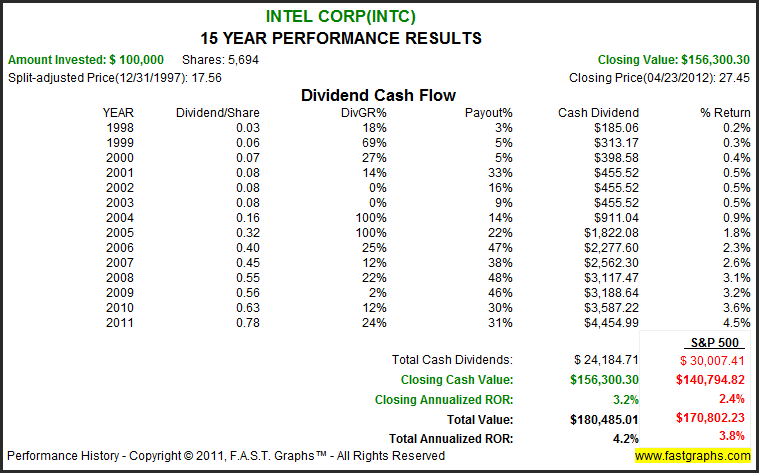
The consensus of 15 leading analysts reporting to Capital IQ forecast Intel Corp’s long-term earnings growth at 10%. Intel Corp has low long-term debt at 13% of capital. Intel Corp is currently trading at a P/E of 10.9, which is below the value corridor (defined by the five orange lines) of a maximum P/E of 18. If the earnings materialize as forecast, Intel Corp’s True Worth™ valuation would be $60.61 at the end of 2017, which would be a 17% annual rate of return from the current price.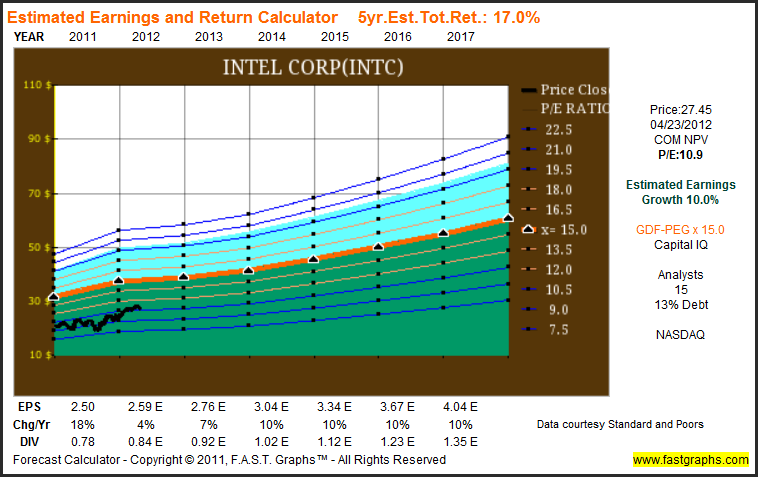
Summary and Conclusions
Generally speaking, technology stocks have recently been weak relative to the overall markets. On the other hand, many are reporting solid earnings and expected to continue to grow at above-average rates over the foreseeable future. The five companies featured in this article appear to represent investments where investors can have their cake and eat it too. Each of these companies are trading at valuations low by historical standards, and at PE ratios that are equal to or below their expected future earnings growth rates. Therefore, investors willing to take on a little risk in order to have it all, growth, value and high income might want to look further into each of these interesting technology investment opportunities. As always, we recommend you conduct your own due diligence.
Disclosure: Long INTC at the time of writing.
Disclaimer: The opinions in this document are for informational and educational purposes only and should not be construed as a recommendation to buy or sell the stocks mentioned or to solicit transactions or clients. Past performance of the companies discussed may not continue and the companies may not achieve the earnings growth as predicted. The information in this document is believed to be accurate, but under no circumstances should a person act upon the information contained within. We do not recommend that anyone act upon any investment information without first consulting an investment advisor as to the suitability of such investments for his specific situation. A comprehensive due diligence effort is recommended.
- English (UK)
- English (India)
- English (Canada)
- English (Australia)
- English (South Africa)
- English (Philippines)
- English (Nigeria)
- Deutsch
- Español (España)
- Español (México)
- Français
- Italiano
- Nederlands
- Português (Portugal)
- Polski
- Português (Brasil)
- Русский
- Türkçe
- العربية
- Ελληνικά
- Svenska
- Suomi
- עברית
- 日本語
- 한국어
- 简体中文
- 繁體中文
- Bahasa Indonesia
- Bahasa Melayu
- ไทย
- Tiếng Việt
- हिंदी
5 Technology Stocks That Offer High Growth And High Yield
Published 04/25/2012, 04:02 AM
Updated 07/09/2023, 06:32 AM
5 Technology Stocks That Offer High Growth And High Yield
3rd party Ad. Not an offer or recommendation by Investing.com. See disclosure here or
remove ads
.
Latest comments
Install Our App
Risk Disclosure: Trading in financial instruments and/or cryptocurrencies involves high risks including the risk of losing some, or all, of your investment amount, and may not be suitable for all investors. Prices of cryptocurrencies are extremely volatile and may be affected by external factors such as financial, regulatory or political events. Trading on margin increases the financial risks.
Before deciding to trade in financial instrument or cryptocurrencies you should be fully informed of the risks and costs associated with trading the financial markets, carefully consider your investment objectives, level of experience, and risk appetite, and seek professional advice where needed.
Fusion Media would like to remind you that the data contained in this website is not necessarily real-time nor accurate. The data and prices on the website are not necessarily provided by any market or exchange, but may be provided by market makers, and so prices may not be accurate and may differ from the actual price at any given market, meaning prices are indicative and not appropriate for trading purposes. Fusion Media and any provider of the data contained in this website will not accept liability for any loss or damage as a result of your trading, or your reliance on the information contained within this website.
It is prohibited to use, store, reproduce, display, modify, transmit or distribute the data contained in this website without the explicit prior written permission of Fusion Media and/or the data provider. All intellectual property rights are reserved by the providers and/or the exchange providing the data contained in this website.
Fusion Media may be compensated by the advertisers that appear on the website, based on your interaction with the advertisements or advertisers.
© 2007-2024 - Fusion Media Limited. All Rights Reserved.
