Back in early 2016 as precious metals rebounded, our work showed that gold stocks were arguably the cheapest they had ever been. They had the worst 5-year and 10-year rolling performance ever, they were trading at potentially 40-year lows on a price to cash flow basis, they were the cheapest ever relative to the stock market and Gold and most notably, the Barron’s Gold Mining Index was trading at the same level as where it had been 42 years ago! The gold stocks enjoyed a massive recovery in 2016 but it was short-lived as the sector corrected and then consolidated (far from the highs) for over a year. Although we have a tendency to be too conservative at times, over a month ago we noted a historical pattern that bodes extremely well for gold stocks over the next few years. That outlook is reinforced by the continued historic value in the gold stocks as exhibited by the following charts.
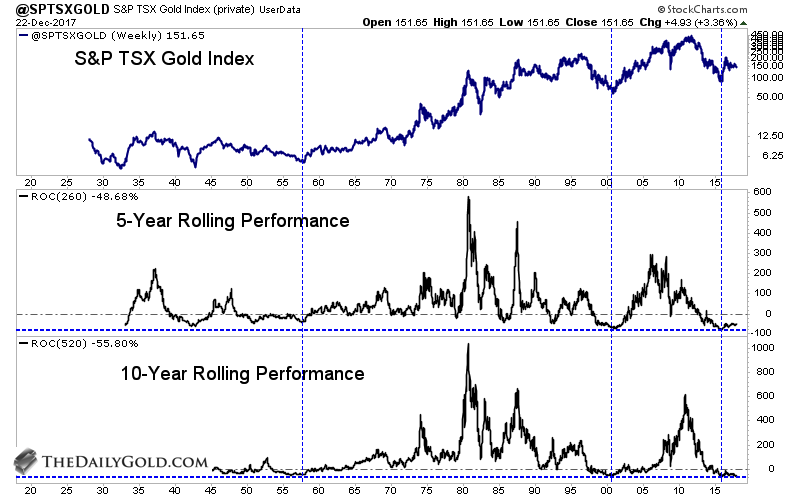
First, we focus on the long-term rolling performance in the gold stocks. The chart below plots the S&P TSX Gold Index (data obtained from Global Financial Data) along with its rolling 5-year and 10-year performance. By that metric, the gold stocks (going back +80 years) were the most oversold in late 2000 and early 2016. If we were to run a 15-year and 20-year rolling performance then the three most oversold periods would be late 2000, early 2016 and the late 1950s. The gold stocks enjoyed massive long-term returns from the late 1950s and the year 2000.
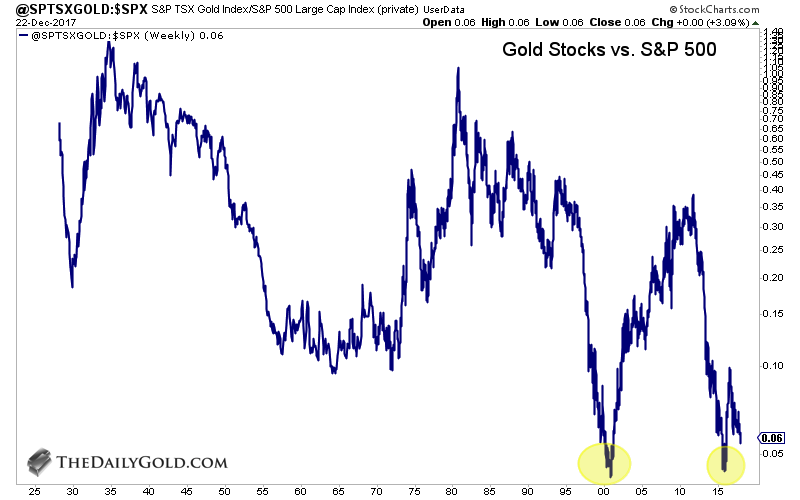
Next we compare the gold stocks to the stock market. We plot the S&P TSX Gold Index against the S&P 500. The ratio appears to be in position to form a double bottom or a higher low as compared to its 2016 low. The 2016 low (in the chart below) is second by a tick to the 2000 low as to when the gold stocks relative to the stock market were the cheapest ever. (However, the Barron’s Gold Mining Index against the S&P 500 did make an all-time low in January 2016). In any case, the gold stocks right now are likely trading at the 97th percentile (out of 100) as far as value relative to the stock market.
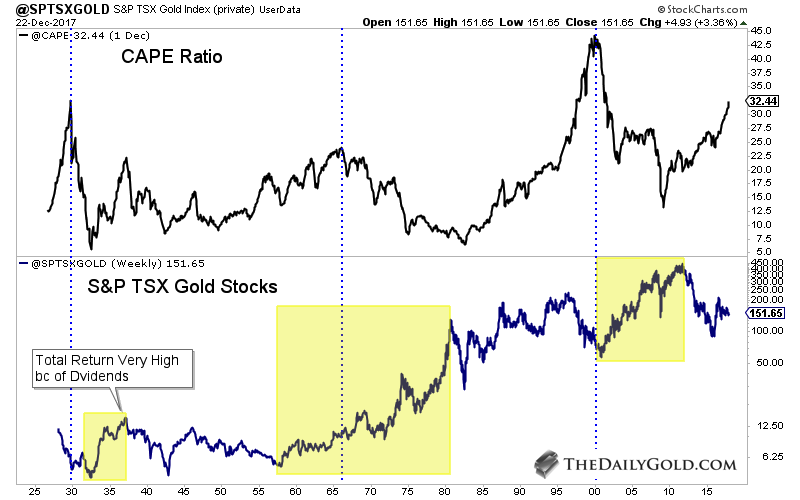
Next is one of my favorite charts. We compare the valuation in the stock market with the performance in the gold stocks. We plot the CAPE Ratio along with the S&P TSX Gold Index. The gold stocks performed fabulously after the CAPE Ratio reached major peaks in 1929, 1966 and 2000. The gold stocks bottomed several years prior to the CAPE peak in 1966 and perhaps we are seeing a repeat of that now. The gold stocks bottomed in early 2016 though the CAPE ratio has continued to rise. We hear plenty of talk about future returns being very low and there being no place to invest. To that, I present this chart!
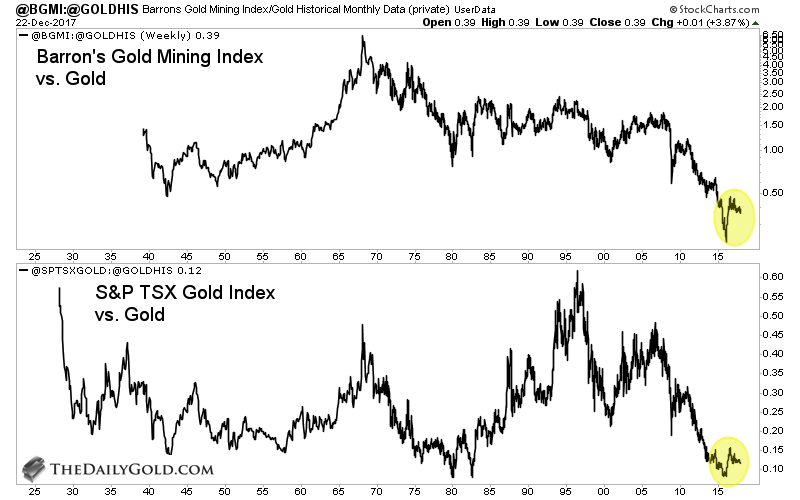
Next we plot the gold stocks relative to Gold. We use both of the historical gold stock indices, (the S&P TSX Gold Index and the Barron’s Gold Mining Index). By the end of 2015 the gold stocks were historically cheap by many metrics. Interestingly, that includes Gold even though Gold itself at the time was down 45%!
Finally, the last chart shows how cheap Gold potentially is. It’s important because the gold stocks could be very cheap when Gold itself may not be cheap. This was somewhat the case in 2012-2013 and that is why gold stocks remained a deep value for several years. However, since then Gold has become so much cheaper relative to the money supply, monetary base, equities, and even bonds. The chart below is from GoldMoney. They plot Gold against FMQ which is the quantity of fiat money.
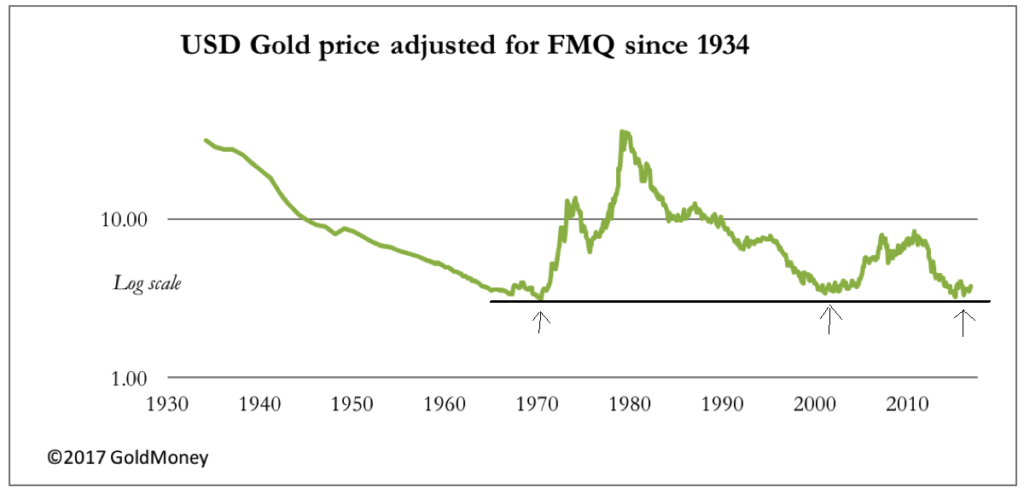
When we step back from the day-to-day and week-to-week wiggles in the gold stocks, we need to realize that a historic low is in place (January 2016) and after a nearly 18-month long correction and consolidation the sector remains extremely and extraordinarily cheap on a historical basis. This, and not the wiggles in charts or market sentiment, ensures that forward returns in the sector will be strongly positive.
Those tools help with market timing and spotting risks and opportunities. While the recent low in gold stocks may be more significant than we think, history suggests a very strong second half of 2018 for the gold stocks. Moving forward, the key for traders and investors is to find the companies with strong fundamentals with value and catalysts that will drive buying.
