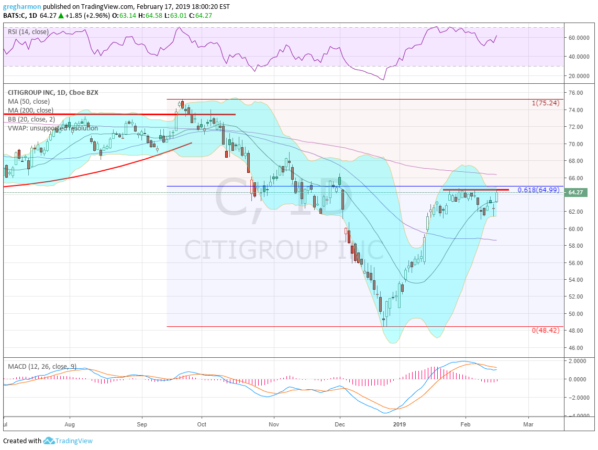
Citigroup Inc (NYSE:C) had a false break out in September and quickly reversed lower. It paused through November before accelerating lower in December, to a Christmas Eve low. After Christmas it started higher though, confirming a Morning Star reversal. That move continued until late January when it met resistance just short of retracing 61.8% of the drop. It pulled back to a higher low on a shallow dip two weeks ago and is now back at resistance.
The Bollinger Bands® are squeezing in, often a precursor to a move. The RSI is turning back up in the bullish zone with the MACD trying to turn back higher. A push through resistance gives a target on a Measured Move to 77. There is resistance at 64.65 and 66.25 then 68.35 and 72.65 before 75.25. Support lower comes at 63 and 61.75 then 60. Short interest is low under 1%. The stock pays a strong dividend at 2.80% but went ex- on February 1st. The company is expected to report earnings next on April 15th.
Looking at the options chains the weekly options for February 22nd show large open interest at the 65 call strike, but also at 60.50 on the put side. The March options have the biggest open interest at the 65 strike by far. The April options cover the earnings report and show large open interest at the 60 put strike, but bigger at the 67.50 call strike.
Citibank, Ticker: $C

- Buy the stock on a move over 64.65 with a stop at 61.50.
- Buy the stock on a move over 64.65 and add a March 8 Expiry 64/60 Put Spread (95 cents) while selling an April 770 Put (68 cents) to pay for most of it.
- Buy the April 65/67.50 Call Spread (91 cents) and sell the April 57.50 Put (62 cents).
- Buy the March/April 67.50 Call Calendar (90 cents) and sell the April 57.50 Put (62 cents).
Elsewhere
Look for Gold to bounce continue higher in its uptrend while Crude Oil joins it with a renewed push higher. The U.S. Dollar Index looks to continue to mark time sideways while U.S. Treasuries are stalled at resistance in their move higher. The Shanghai Composite is driving higher and Emerging Markets are basing after a digestive pullback.
Volatility looks to remain very low keeping the bias higher for the equity index ETF’s SPY, IWM and QQQ. Their charts showed strong weekly moves with momentum for more as the SPY breaks firmly over the 200-day SMA and the QQQ joining it. Only the IWM is left to join the club and it is driving higher fast. Use this information as you prepare for the coming week and trade them well.
The information in this blog post represents my own opinions and does not contain a recommendation for any particular security or investment. I or my affiliates may hold positions or other interests in securities mentioned in the Blog, please see my Disclaimer page for my full disclaimer.
