by Clement Thibault
As is the case every year, some stocks are worthy of recognition for extraordinary performance while others thoroughly disappointed investors. In this four-part series, which we'll be publishing intermittently over the next few weeks, we'll take a look at how well, or not, specific groups of stocks repaid investors during 2016.
We've borrowed our designations from the world of sports. Today's article will focus on Comeback Stocks of the year. After the Christmas holiday we'll take a look at the S&P 500 MVPs, the best performing stocks on the benchmark index. Toward the end of the holiday week we'll consider the Rookies of the Year, those stocks that IPO-ed most successfully in 2016. Finally, as the new year begins, we'll consider the stocks that most disappointed investors, the 'draft picks' that turned out to be a bust.
When it comes to comebacks of the year, performance metrics are important. However, unlike MVPs—whose rankings are based solely on performance metrics—comebacks have a subjective aspect as well. For this list, presented here in ascending order, we also took into account general sentiment on the stock, sector and industry, and we applied a longer perspective if warranted, rather than just considering performance in 2015 vs 2016.
#4. Wynn Resorts
Sector: Services, Casinos
- 2015 Performance Range: $148.59 to $69.19, -53%
- 2016 Performance Range: $69.19 to $90.12, +30%
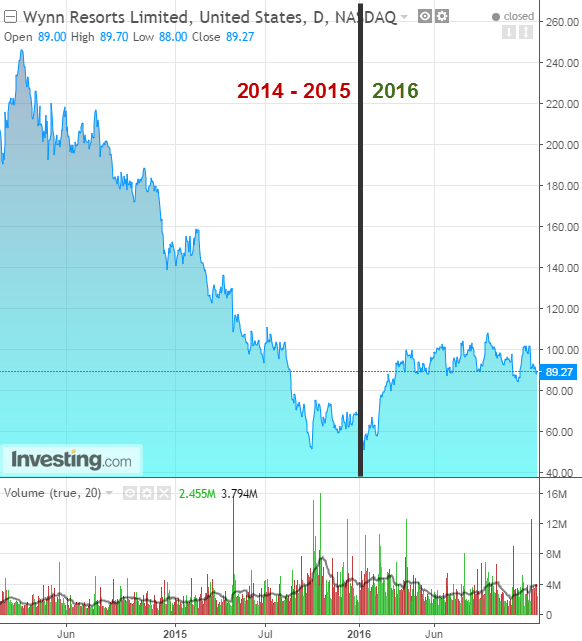
Looking just at the performance of Wynn Resorts' (NASDAQ:WYNN) stock last year doesn’t do justice to the level of 'difficulty' of this year's comeback, even though the stock lost an incredible 53% last year. Wynn's troubles go back further than that, to the beginning of 2014 – when Chinese authorities decided to focus on corruption, using Macau's gaming industry as their primary example. Not surprisingly, that scared away many of China's high rollers who found other gambling destinations in Asia or the US.
During March 2014, WYNN stock peaked at a closing price of $246, after which it saw a two-year decline, bottoming during October 2015 at just under $51. That’s a negative return of 78% in just under two years.
Wynn's resurgence this year is being fueled by the end of revenue and earnings declines, as well as a new Macao resort, Wynn Palace, which investors are hoping will strengthen Wynn's luxurious Macao offering. The Palace opened on Aug 22 of this year, adding 1700 rooms and 350 tables to the Wynn brand in Macau.
Right now it is considered to be the most luxurious hotel in the autonomous region, sometimes referred to as the "Las Vegas of Asia." It puts Wynn in an excellent position to take advantage of Macau's comeback as the Chinese government shifts its corruption focus elsewhere.
The year ahead: Wynn stock has recovered from its lows. It closed yesterday at $89.27. Operating revenue and gross profit are on the rise. Though it's hard to see Wynn catapulting back to its $240 high anytime soon, given continued growth which looks more than possible, another year like 2016 where the share price increases by 30% seems a reasonable expectation.
#3. Best Buy
Sector: Services, Retail
- 2015 Performance Range: $38.17 to $30.04, -21%
- 2016 Performance Range: $30.04 to $46.56, +55%
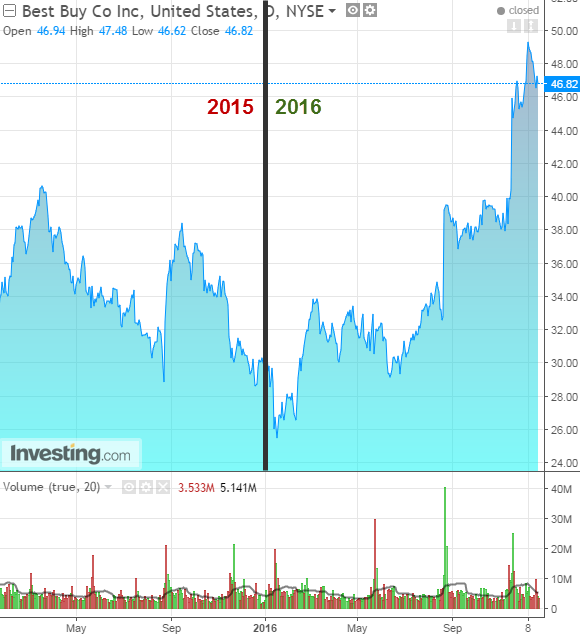
The Best Buy (NYSE:BBY) comeback story has been fueled by consumer sentiment more than anything else. While many think traditional bricks-and-mortar retail is dying—and the jury is still out on whether they're wrong—Amazon (NASDAQ:AMZN) continues to consume larger and larger portions of the retail pie even as they become less and less willing to share. For proof, check out "Amazon Go", the company's vision of what the future of retail could look like.
Still, many analysts underestimate the ability of traditional retailers to adapt their businesses to new retail realities. Best Buy's strategy of opening specialty stores within their stores offers an excellent example of a traditional retailer fighting back.
A few years ago, in order to provide a better shopping experience for customers alongside better audience targeting, Best Buy began dedicating discreet boutiques within each store to such popular telecom and consumer electronics brands as Verizon (NYSE:VZ), AT&T (NYSE:T), Sony (NYSE:SNE) and Samsung (KS:005930), for example.
By understanding that the conceptual advantage of traditional retail outlets is in the physical shopping experience—being able to see and feel the television or smartphone you want prior to purchase, while at the same time knowing there's an actual representative on hand to talk to about service, problems or simply to answer questions—and delivering on the advantages often tips the scale in favor of bricks-and-mortar retailers versus e-tailers. Enhancing and delivering on this advantage has been helping turn Best Buy around.
Indeed, for the past two straight quarters, Best Buy has posted revenue growth, something it hasn’t done since 2011. Annual revenue has been shrinking every year since 2010, yet this year Best Buy has a good shot at posting their first quarter of annual growth in 6 years—contingent on Q4 sales, of course. Best Buy has also strengthened its online presence by expanding its same-day delivery to major metropolitan areas across the United States.
The year ahead: Best Buy, with 1431 stores across the US, 192 in Canada and 23 in Mexico, is undoubtedly making the best of the cards it's been dealt so far. It's currently trading at $46.82 as of yesterday's close, its highest price since the 2008 crash. Based on market conditions, competition, and Best Buy's historically high P/E ratio of 14.4 vs 5 year average of 12 for the industry, it's unlikely that BBY will soar, or even rise quickly. Rather, we expect Best Buy to continue growing at the market's pace. We see it as a slow but steady performer.
#2. Two Oil and Gas ETFs:
SPDR S&P Oil & Gas Exploration & Production (NYSE:XOP)
- 2015 Performance Range: $47.30 to $30.22, -36%
- 2016 Performance Range: $30.22 to $42.22, +39%
SPDR S&P Oil & Gas Equipment & Services (NYSE:XES)
- 2015 performance: $28.10 to $17.54, -37%
- 2016 performance: $17.54 to $22.62, +29%
It wouldn't be fair to single out just one company for either our #2 or #1 picks for comeback stocks of 2016. Because of low commodity prices in 2015 a broad array of oil and gas sector companies, as well as mining companies, had notable comebacks in 2016. Therefore, we're focusing on two ETFs in the oil and gas sector and one metals and mining ETF.
Outlooks and sector considerations for all of the ETFs are detailed below. We also provide a holiday bonus at the end of the post, a few notable company comeback stocks for each of these sectors.
#1. SPDR S&P Metals & Mining (NYSE:XME)
- 2015 Performance: $30.74 to $14.95, -51%
- 2016 Performance: $14.95 to $31.16, +108%
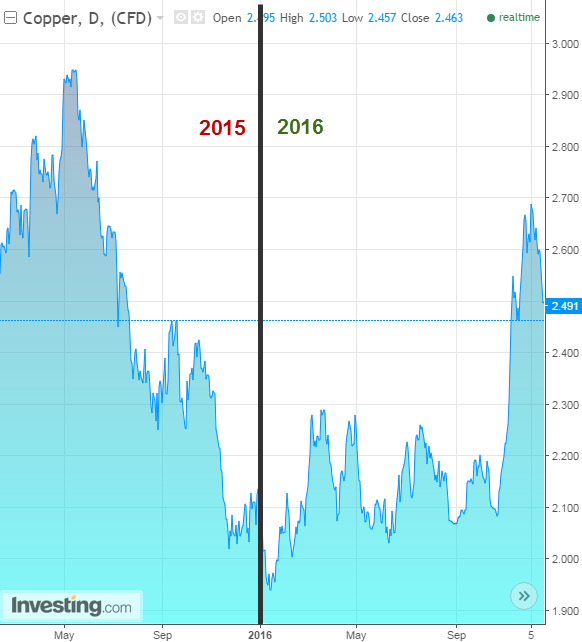
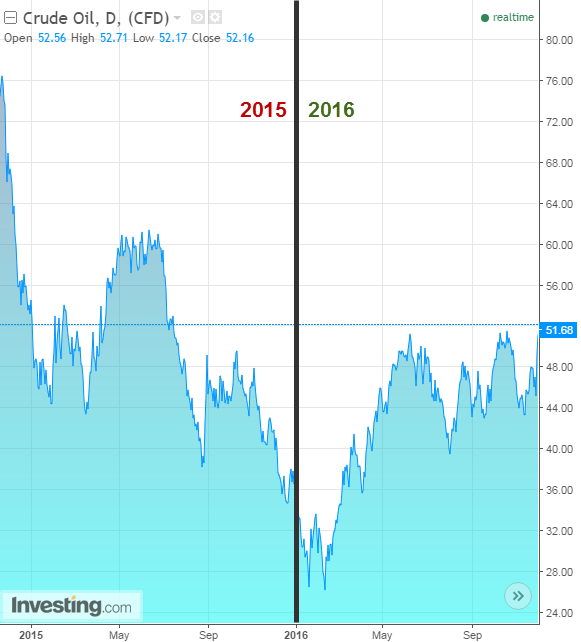
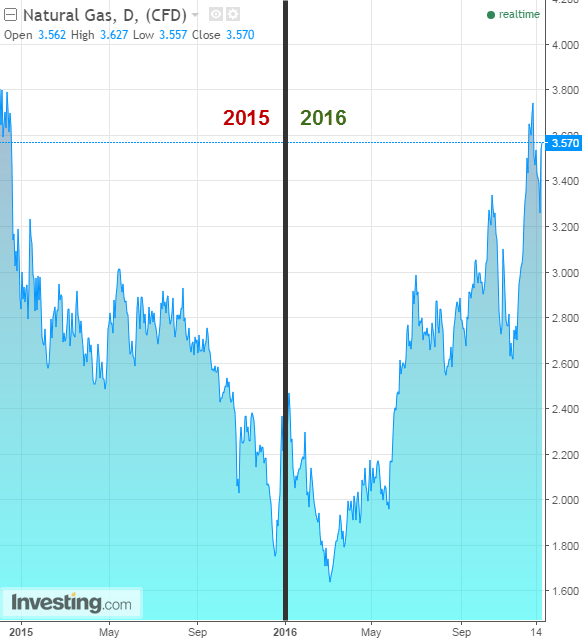
As different as they are, the oil and gas industry as well as the metals and mining sector all suffered from the same issue in 2015 – low commodity prices. Gas hit $1.61 and oil dived to $26.05.
Some metals saw steep declines as well including copper which went as low as $1.93. Given fixed infrastructure costs, labor, and distribution agreements, low commodity prices have the capacity to do major damage to company balance sheets and income statements. Commodity prices were so detrimental in fact, that many companies in these sectors were approaching bankruptcy at one point or another.
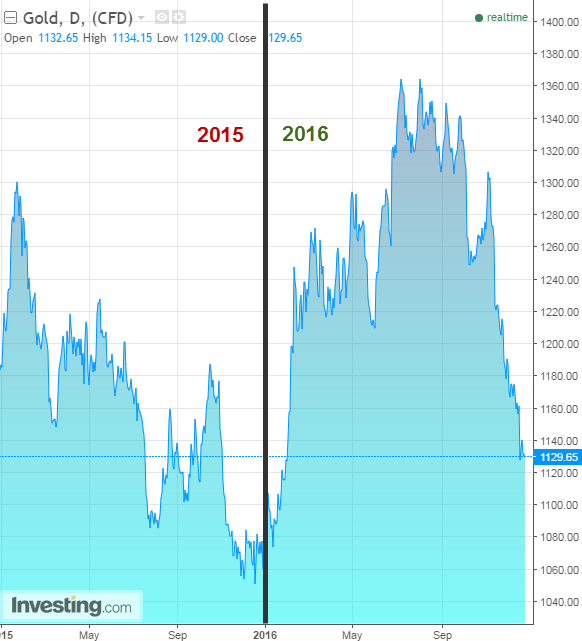
However, the resurgence of energy commodities, rising political and economic uncertainty leading to higher gold prices during late 2015 and the middle of 2016, as well as the hope of significant future demand for steel after Trump's election victory in the U.S completely turned these industries around.
The year ahead: Many variables are in play in these markets. OPEC's recent decision to cut production, even if just for a few months, is good news for oil producers. Natural gas is still struggling with a supply glut and a relatively mild winter in the US thus far.
Gold's price often moves according to market volatility and right now there's no rush to safe havens. As well, the steel rally will continue as long as major infrastructure development is plausible.
While energy markets have calmed and prices found footing at higher ranges (oil at around $50, natural gas above $3), gold is once again on the decline. These are definitely not 'steady-as-they-go' sectors and 2017 will no doubt again bring crises and opportunities that will rile the markets.
But as long as winter temperatures are lower than expected, natural gas will struggle to push upward. Oil should continue heading higher as long as no oil producers go rogue, sabotaging the current production cut agreement. As for gold, the markets handled the Trump election and Fed rate hike well, so don't expect a rebound for the yellow metal in the near-term as everyone has their sites on Dow 20,000.
Bonus: Company Comeback Stocks
Notable Oil & Gas: ONEOK (NYSE:OKE) (+137%), Chesapeake Energy (NYSE:CHK) (+62%), Halliburton (NYSE:HAL) (+57%)
Notable Metal & Mining: United States Steel (NYSE:X) (+337%), Freeport-McMoran Copper & Gold (NYSE:FCX) (+110%), Newmont Mining (NYSE:NEM) (+76%).
