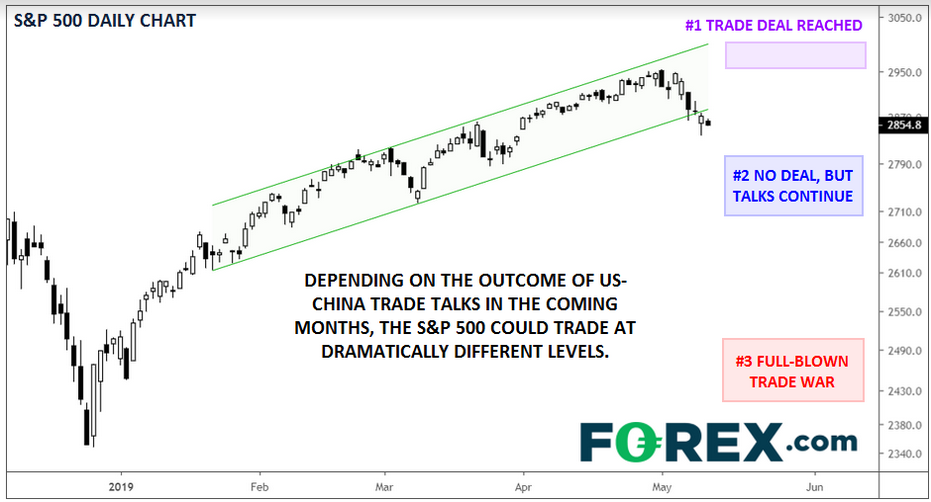
Major U.S. stock indices were lower by about 1% midday Friday after the U.S. more than doubled its tariffs on $250B in Chinese goods overnight (though European and some Asian indices are shrugging off the news so far). While U.S.-China trade talks are will resume, hopes of a breakthrough deal are rapidly fading, leaving indices poised for their worst week since the December selloff.
Looking ahead, we see three main scenarios over the coming weeks, with three different outcomes for the S&P 500:
1) Trump-Xi Summit To Sign Comprehensive Trade Agreement
Given the developments, this may be the least likely scenario, at least in the short term. That said, if we do see a breakthrough in talks in the next couple of weeks, it would take arguably the biggest risk to stock investors off the table. It’s worth noting that the tariffs don’t truly take effect until June; any goods currently in transit are not subject to the new import taxes as long as they reach the U.S. this month.
In the event of a comprehensive agreement later this month, we could see the S&P 500 rally to new record highs above 2950 and potentially toward the psychologically significant 3000 level on expectations of faster global growth.
2) No Deal, More Talks Scheduled
Based on the market’s movements this week, this appears to be traders’ “base case” scenario: U.S. and Chinese negotiators maintain open lines of communication and continue to schedule occasional meetings while the newly escalated U.S. tariffs gradually weigh on growth on both sides of the Pacific. Unlike previous rounds of tariffs, international businesses did not have enough lead time to cushion the impact of the import taxes, so the economic impact will be larger in magnitude and felt sooner.
This scenario would be a headwind for the S&P 500 and could gradually push the index back toward the 2700-2800 range, depending on how long it lasts.
3) No Deal, China Retaliates
In the doomsday scenario, negotiations cease entirely. The U.S. institutes tariffs on the remaining $325B in Chinese goods, while China retaliates through a combination of its own tariffs, currency devaluation, policy stimulus and greater restrictions on U.S. companies. A true “trade war” between the planet's two largest economies could drive the global economy into recession, potentially taking the S&P 500 back toward the mid- or even lower-2000s, as we saw back in December.

Source: TradingView, FOREX.com
Both extreme scenarios (#1 and #3) remain relatively unlikely, but the developments over the last week have increased the odds of a full-blow trade war and decreased the probability of an imminent agreement. Moving forward, traders will be keeping a close eye on trade headlines and evaluating how they shift the probabilities of each of these scenarios.
Cheers
