There has been a lot of angst in the markets as of late as interest rates have risen back to the levels last seen, oh my gosh, all the way back to last year. (Okay, a bit of sarcasm, I know.) But from all of the teeth gnashing and rhetoric of the recent rise in rates, you would have thought the world just ended. The chart below puts the recent rise in rates into some perspective. (You have to kind of squint to see it.)
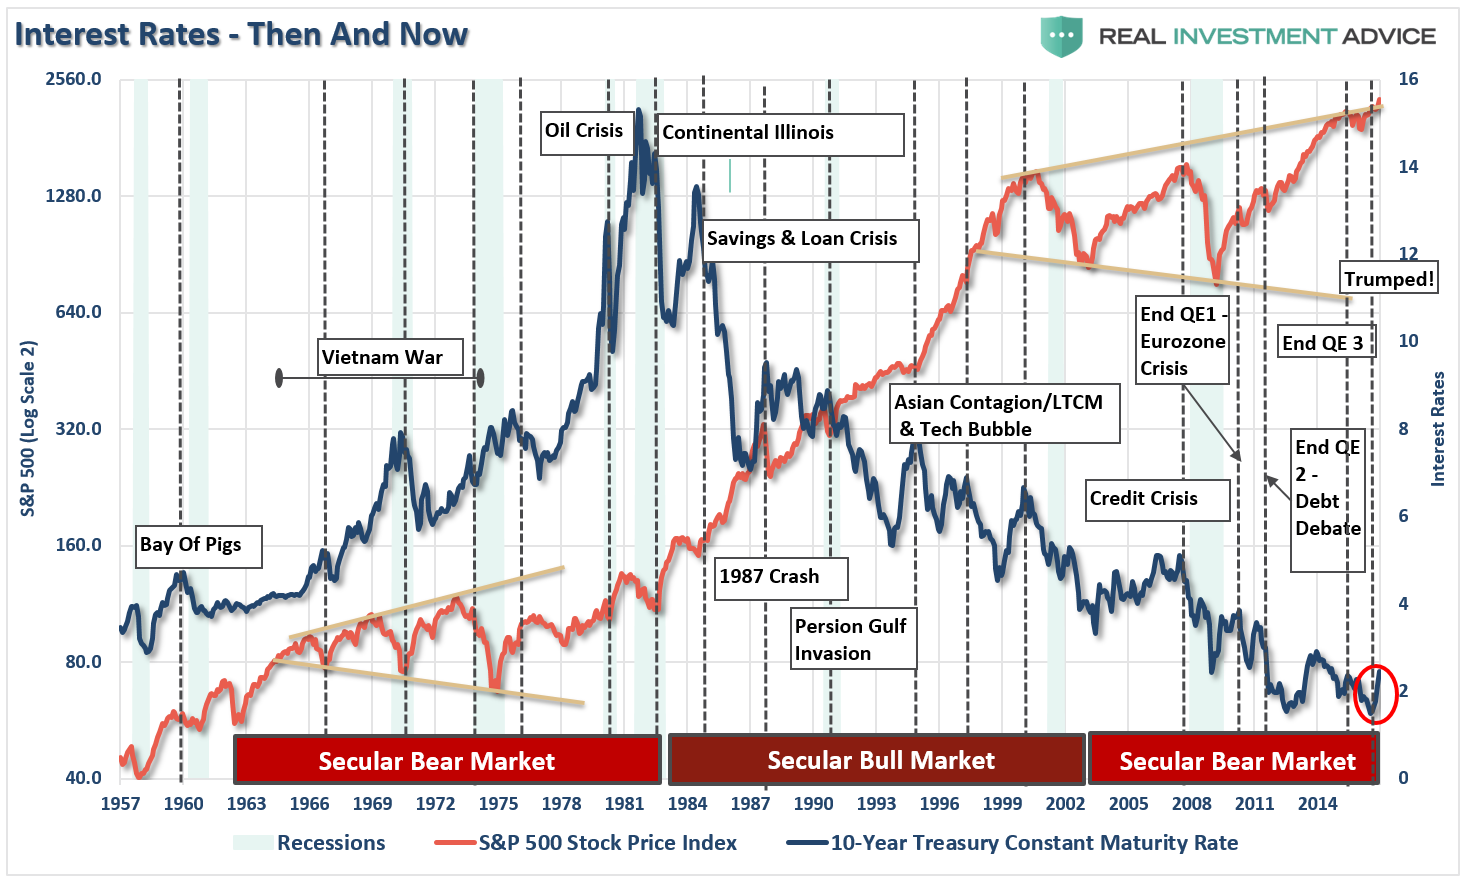
While the bump in rates has been fastened to the recent election of Donald Trump, due to hopes of a deficit expansion program (read: more debt) and infrastructure spending which should foster economic growth and inflation, it doesn’t explain the global selling of U.S. Treasuries.
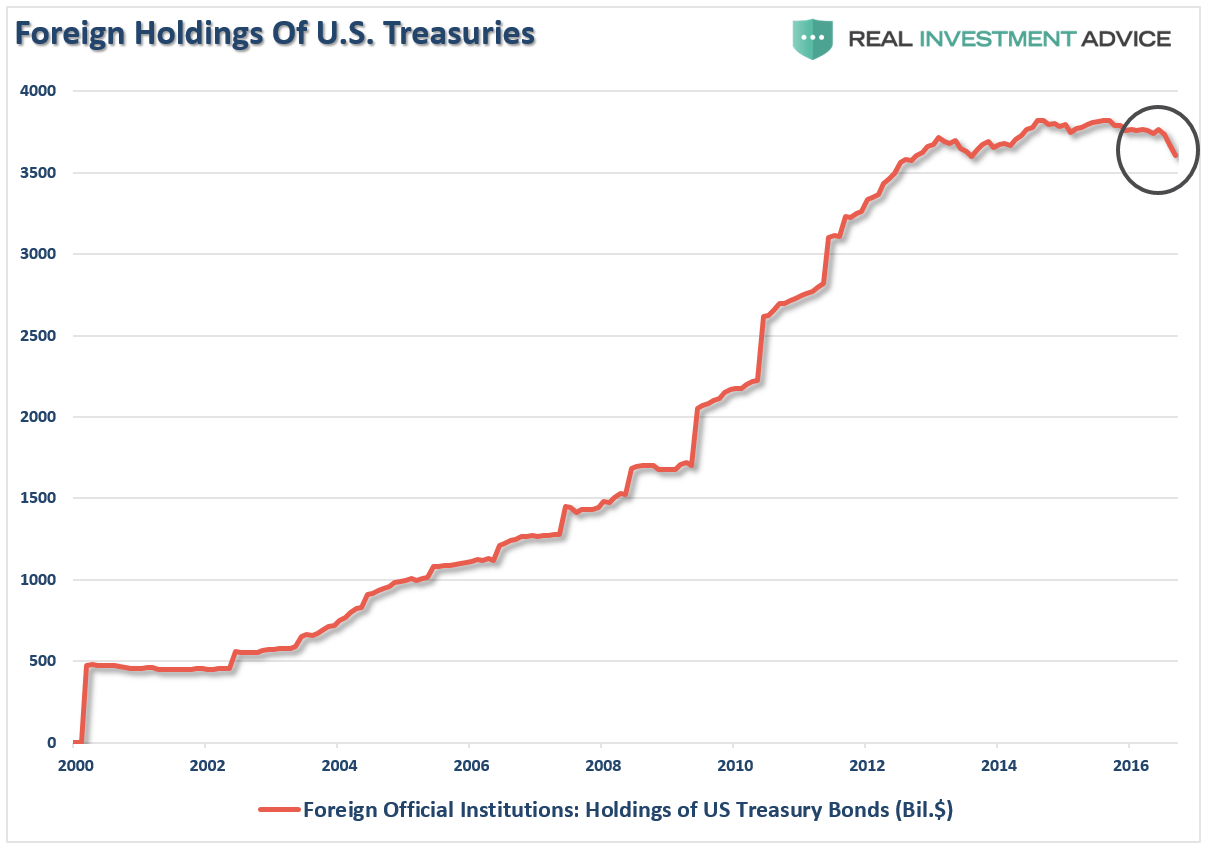
For that answer, we only need to look at one country – China.
It is important to understand that foreign countries “sanitize” transactions with the U.S. by buying treasuries to keep currency exchange rates stable. As of late, China has been dumping U.S Treasuries and converting the proceeds back into yuan in an attempt to stop the current decline. The stronger dollar and weaker yuan increase the costs of imports into China from the U.S. which negatively impacts their economy. This relationship between the currency exchange rate and U.S. Treasuries is shown below. (The exchange rate is inverted for illustrative purposes.)
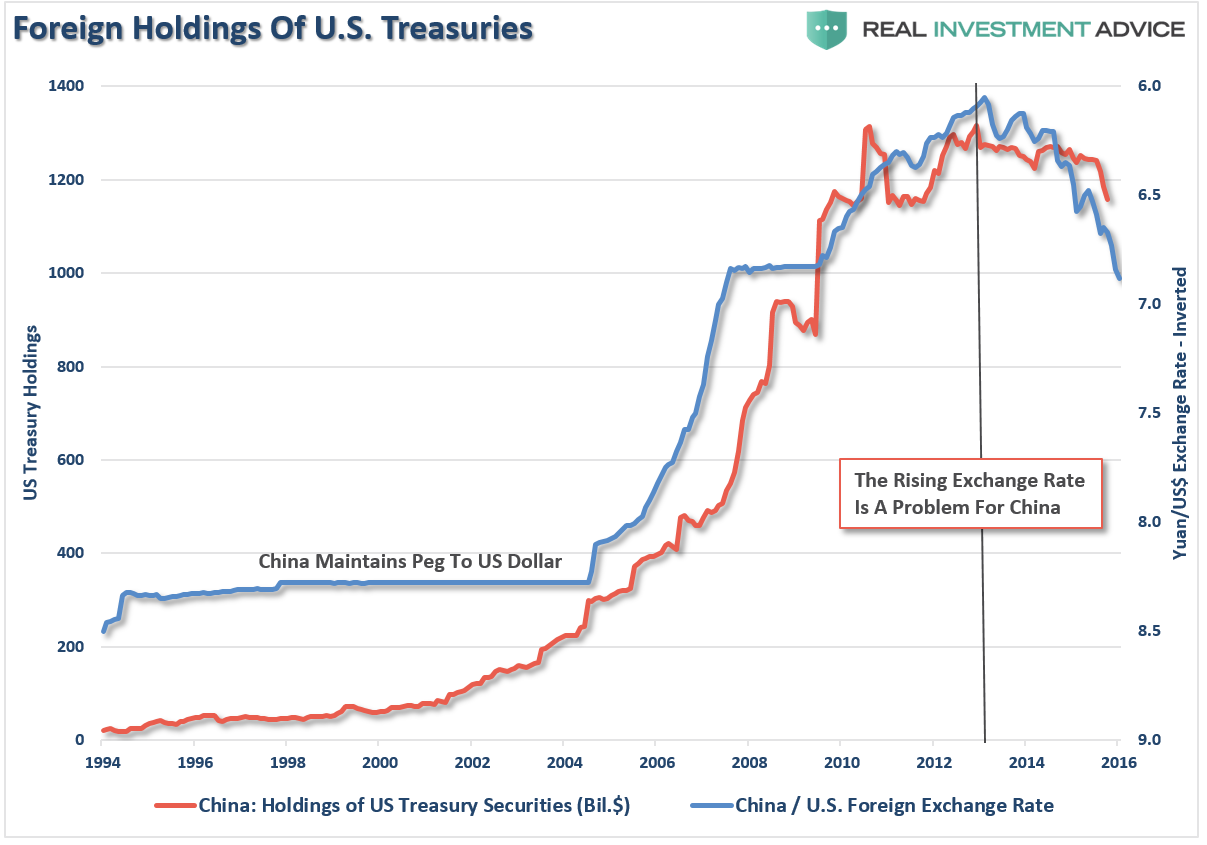
The selling of Treasuries by China has been the primary culprit in the spike in interest rates in recent months and is likely quickly approaching its nadir. As I will discuss in a moment with respect to the trade deficit, there is little evidence of a sustainable rise in inflationary pressures. The current push has come from a temporary restocking cycle following a very weak first half of the year economically speaking, and pressures from higher oil, health care and rental prices.
As noted by Horseman Capital in their recent note to investors (Via Zerohedge):
“Asia is the source of most global demand for commodities, while also a huge supplier of goods into the US. Asian currencies have followed US bond yields higher and lower since the 1990s, as well as followed commodity prices higher and lower over that time. There has been one time when this relationship has broken down. In 2007 and 2008.
Today we are seeing the reverse, I believe. The Chinese financial system is showing signs of stress. Corporate bond yields are rising, the Chinese Yuan is weakening, and outflows are continuing. In my view, the Trump election has made a large Chinese devaluation more likely. Mainland Chinese investors are desperately trying to get out of the Yuan, and the People’s Bank of China is trying to defend the value of the Yuan. They are doing this by selling treasuries.”
This is shown, the annual rate of change in U.S. bond holdings by China is rapidly approaching historical lows (axis is inverted).
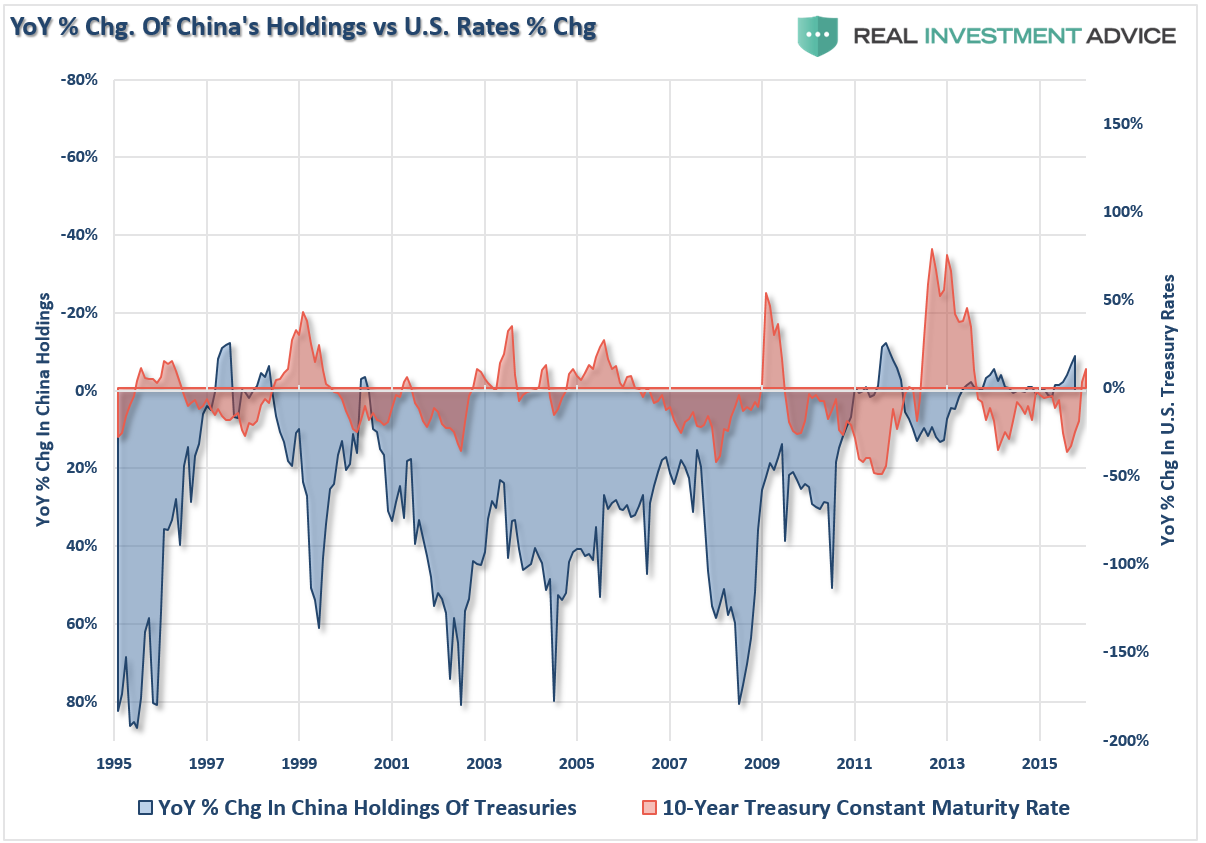
“The problem with this is that the more treasuries the PBOC sells, the more yields are likely to rise, putting more pressure on the yuan. It seems to me that the PBOC is stuck in a doom loop. But as I noted in my market view, the PBOC is running out of options.
In my view, the macro model that I have been using to think about markets still looks valid, despite recent moves. The model indicates that it is impossible for countries that have engaged in QE to then normalize interest rates without causing financial crises with their trade partners. Since 2013, we have had the taper tantrum, devaluations in India, Russia, and Brazil, which all helped to drive long dated treasuries to new lows. Now the market is thinking the US will normalize rates, and the second biggest economy in the world is struggling. A rerun of 2007/8 is looking likely to me.” – Russell Clark, Horseman Global
Then there is simple issue that when virtually everyone is on the same side of trade, in this case short Treasuries, reversions tend to be rather abrupt. As Edward Harrision penned at Credit Writedowns:
“Jamie McGeever over at Reuters posted a chart from Citigroup (NYSE:C) that is very important. Citi research shows speculators’ aggregate net short position in US Treasuries now at 5 standard deviations above normal – meaning everyone is now on the same side of the trade – short US Treasuries.”
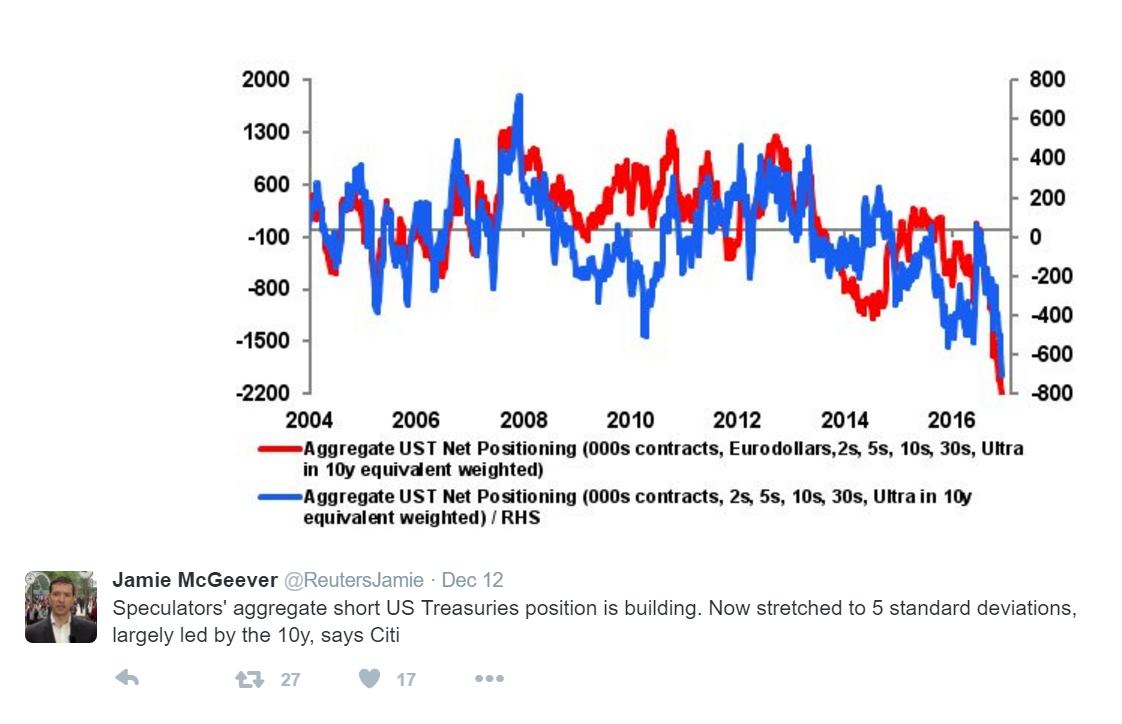
“With everyone piled into a short position on safe assets, all we need is one crisis trigger to create the mother of all short-covering rallies back into safe assets, not just in the US but globally.”
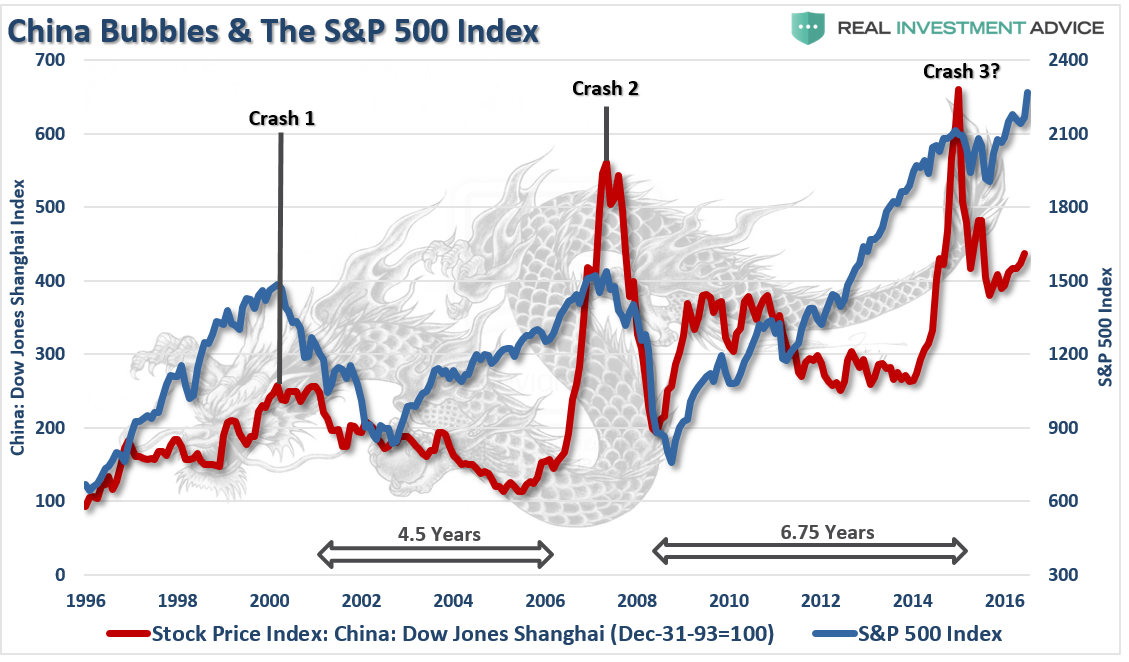
But what kind of crisis might that be? Well, considering the plunge in the yuan and the pressures on China, you might want to pay attention to the Shanghai index.
“Investors seem to have once again managed to fool themselves that geopolitics won’t matter. Be very careful with this one. Not every problem can be solved with monetary policy. And the response to every tweet won’t always be an editorial.” – Richard Breslow
Trade Doesn’t Suggest Strong Levels Of Inflation Or Growth
I mentioned above that I wanted to discuss the trade deficit and the expectations of rising inflationary pressures. While there are indeed EXPECTATIONS that inflation will be a problem in the future, there is currently no evidence supporting those expectations currently.
While there has been a small bump in prices of imports and exports, which coincides with the bump in oil/energy prices, the trend of pricing power is still sorely negative.
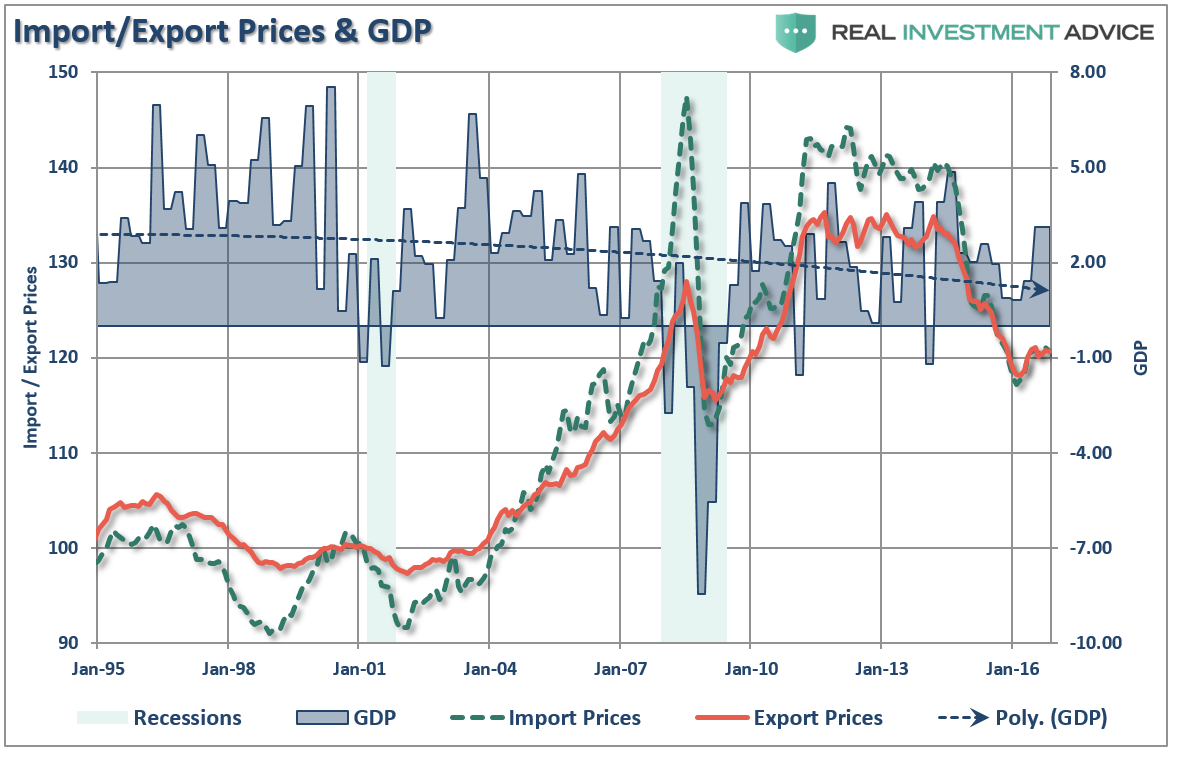
Importantly, declines in import/export prices to such a degree have been indicative of recessions in the past. With the dollar rising, which puts pressure on exports, the recent bounce in pricing power is likely temporary and will push toward lower levels putting downward pressure on corporate earnings and economic growth.
It is not just import/export prices that are trending weaker but we are seeing the same weakness prevail in industrial production and capacity utilization. While year-over-year rates have improved recently, following an extremely weak 4th-quarter last year, the negative trend in production and utilization suggests little about a resurgence of economic activity which would foster a demand-push inflationary rise.
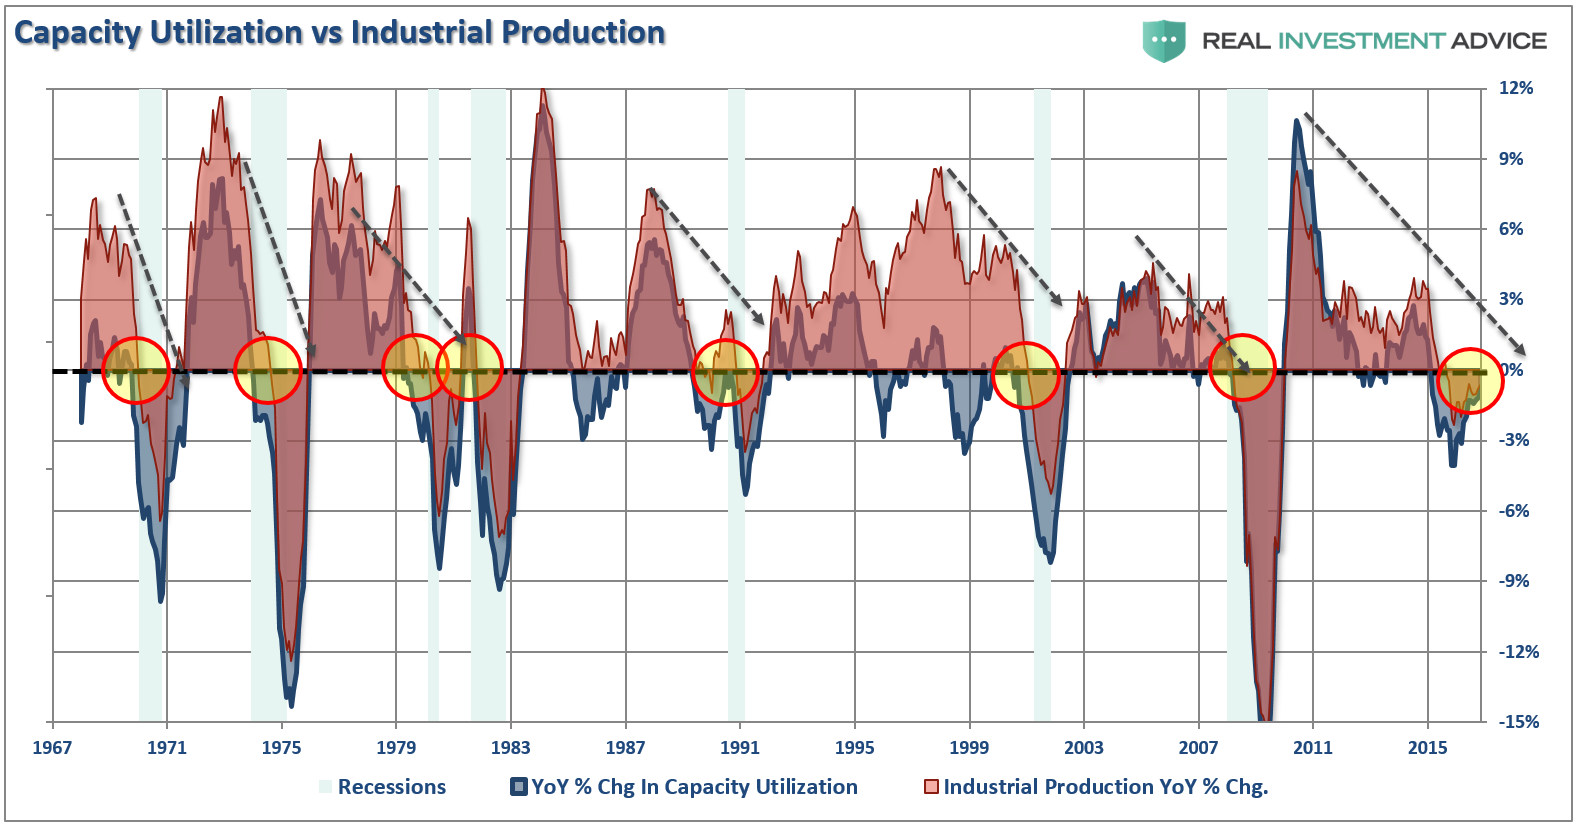
Just from an anecdotal view, declines of this magnitude and duration have previously been more coincident with the onset of a recession than not.
Inflation can be both good and bad. Inflationary pressures can be representative of expanding economic strength if it is reflected in the stronger pricing of both imports and exports. Such increases in prices would suggest stronger consumptive demand, which is 2/3rds of economic growth, and increases in wages allowing for absorption of higher prices. That would be the good, but unfortunately it is not the case.
The dichotomy between expectations of inflation and its ultimate reality will likely soon be recognized.
Rate Hike A Vote Of Confidence? Really?
So, the Fed finally, after more than a year of jawboning, hiked interest rates. But it was not the rate hike that was important but the commentary that went along with it. According to Ms. Yellen:
- YELLEN: EXPECT ECONOMY WILL CONTINUE TO PERFORM WELL
- YELLEN: CURRENT FFR ONLY MODESTLY BELOW NEUTRAL RATE
- YELLEN: ECON OUTLOOK ‘IS HIGHLY UNCERTAIN’
- YELLEN: UNEMPL RATE ‘TOUCH LOWER’ THAN SEEN IN PROJECTIONS
- YELLEN: RATE HIKE ‘IS A VOTE OF CONFIDENCE IN THE ECONOMY
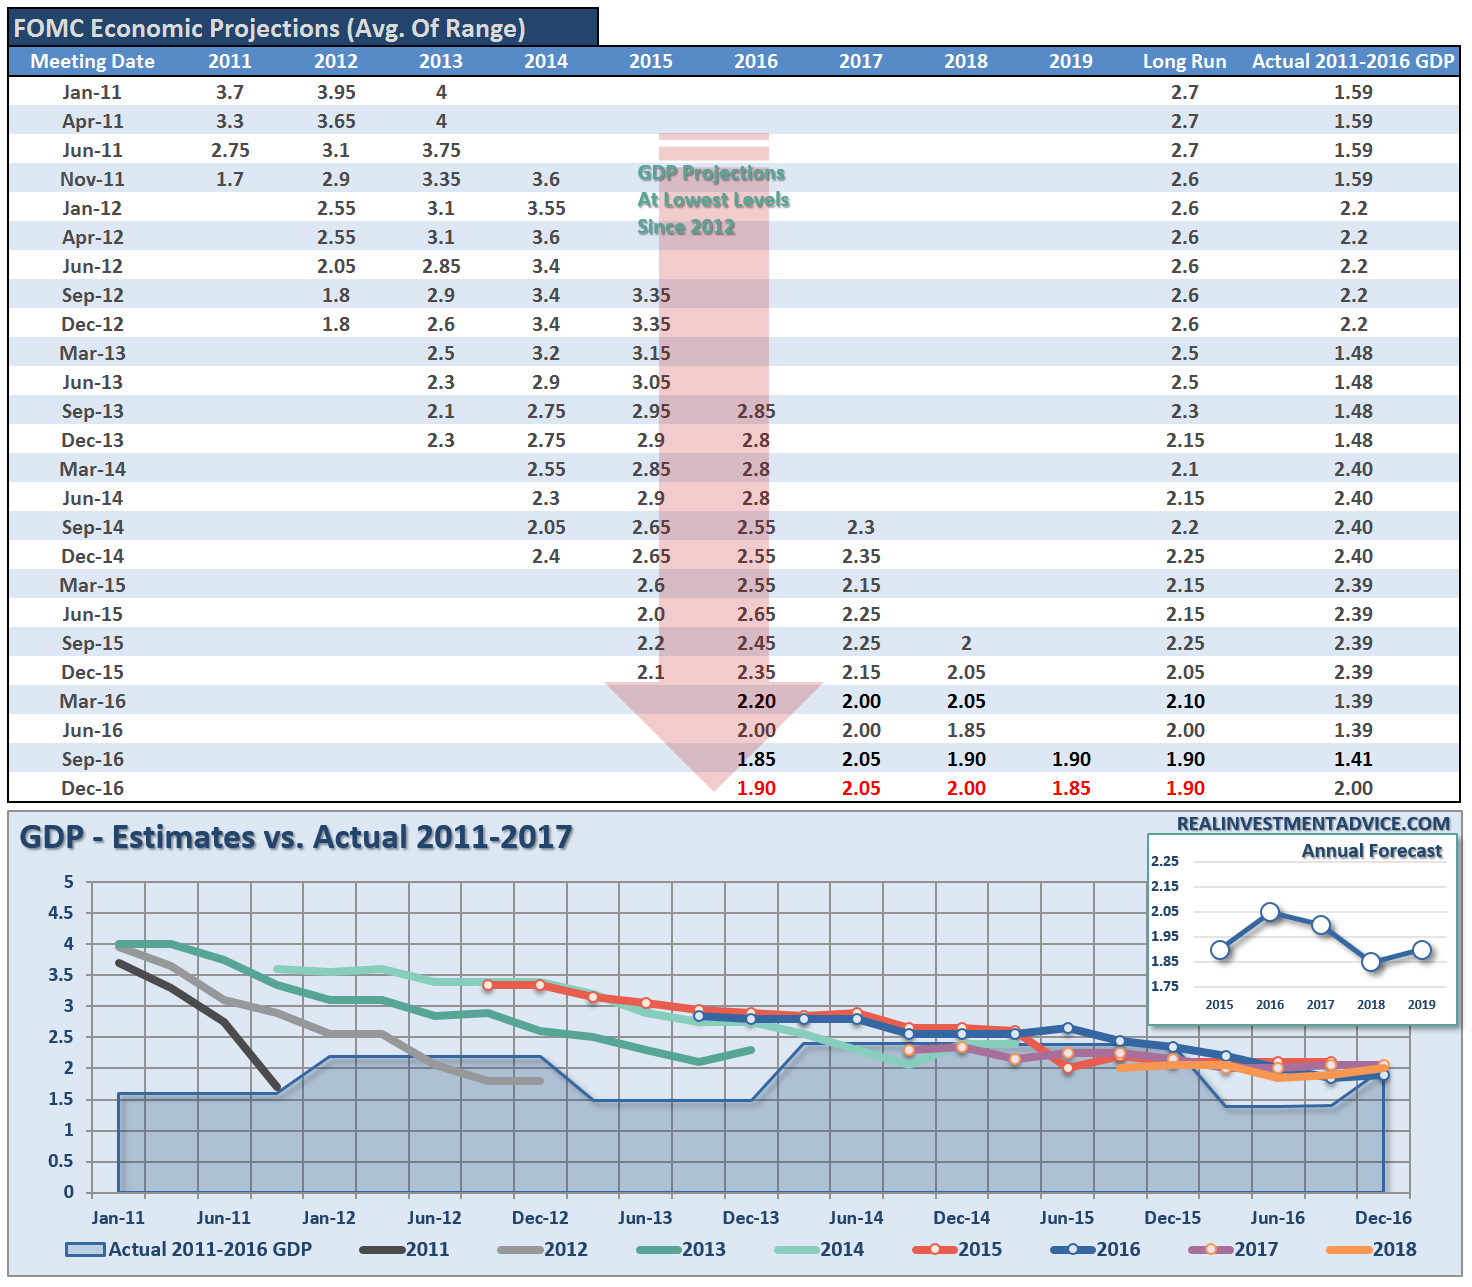
Really? The rate hike was a vote of confidence in the economy? This is irony considering the direction of growth since 2011 has been consistently BELOW expectations set by the Fed as shown by the median of their own forecasts versus reality.
Of course, one of the key comments was her outlook on employment when she stated:
- YELLEN: LABOR MKT LOOKS LIKE IT DID BEFORE RECESSION
She is right, it does. This according to the Fed’s own Labor Market Conditions Index.
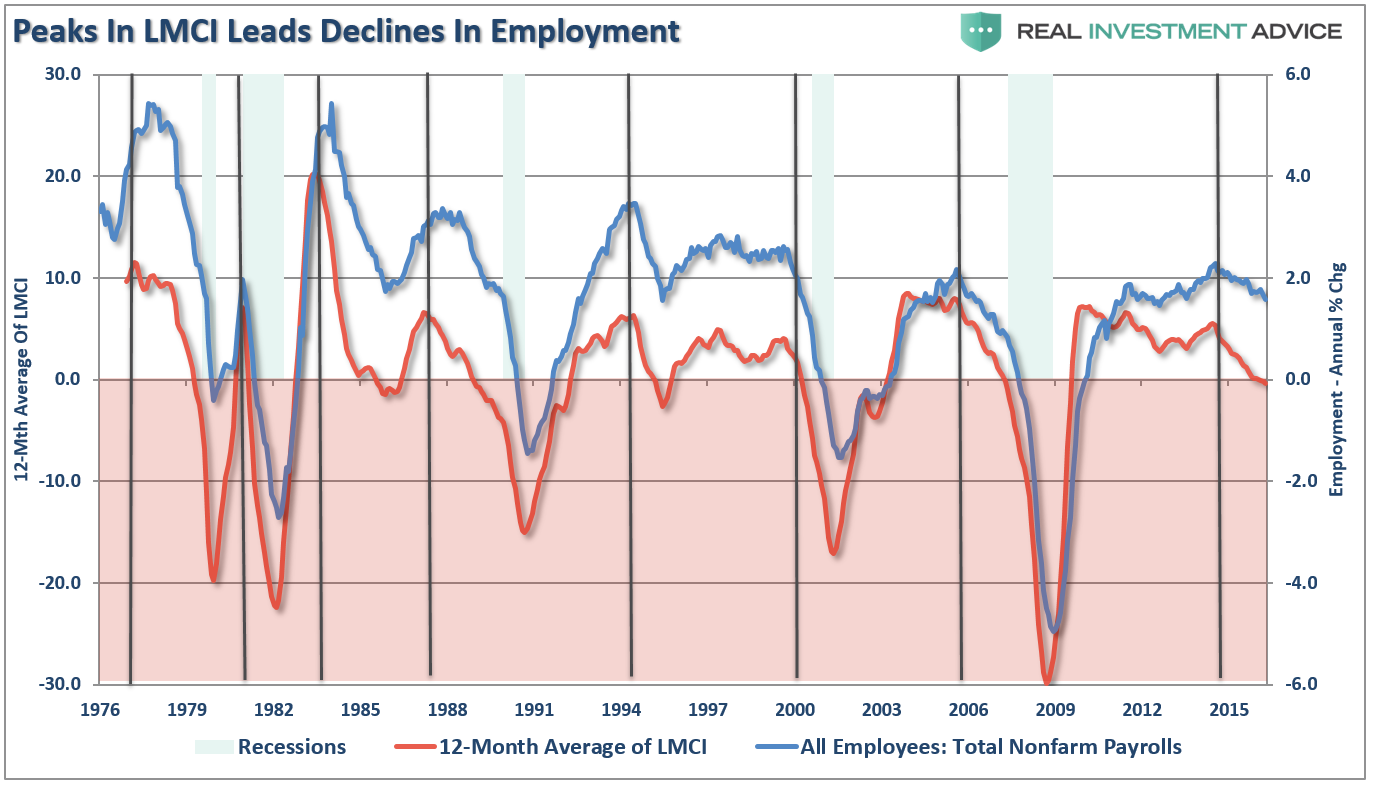
Historically speaking, peaks in the 12-month average of the LMCI index have been coincident with declines in employment and the onset of weaker economic growth.
While the Fed raised it’s longer term interest rate forecast, and projected three more hikes to the Fed Funds Rate in 2017, there is a strong probability this is the same wishful thinking they have had over the last two years.
As shown in all the data above and the EOCI index below (a broad composite of manufacturing, service and leading indicators), the current economic bounce is likely another in a series of temporary restocking cycles. These cycles have been repeatedly witnessed after cyclical slowdowns in economic growth. Furthermore, as shown below, with the broader economy operating at levels more normally associated with recessions than expansions, there is little suggesting an ability to support substantially higher rates or generate inflationary pressures above 2%.
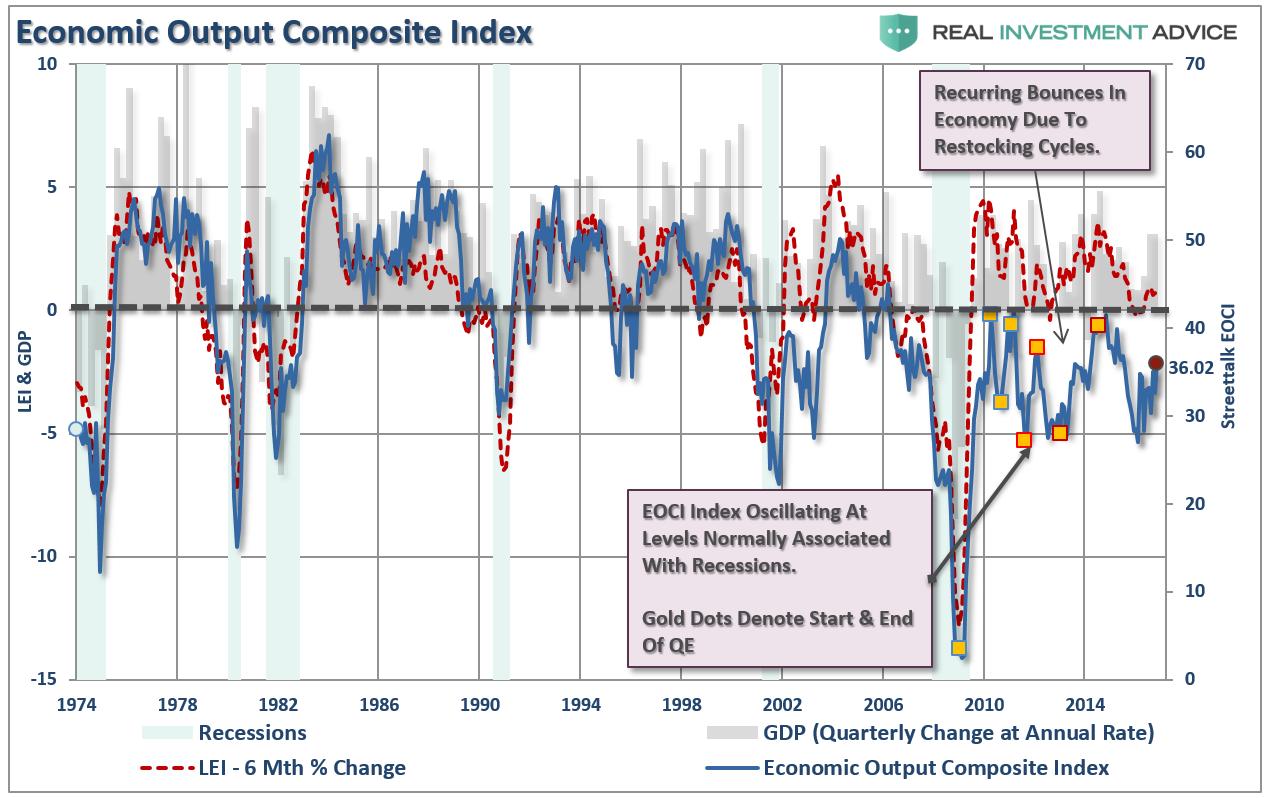
Which is why interest rates on the 10-year treasury have likely seen their peak currently and will be lower in 2017 as overly exuberant expectations are dragged lower by economic realities.
