Most traders neglect to look at the big picture thus only focusing on the daily-fluctuations, and the problem with that is, they tend to let their emotions get in the way and not able to forecast the market accurately.
I am not saying to forget about the daily-fluctuations, but what I am saying is, we have to keep everything accounted for: Minor, intermediate, and macro term to accurately forecast the probability of a direction.
In this article, I want to share three stocks that we are currently watching to engage for a long-term trade ideas. Of course, there are other factors that must be accounted for, and not just the monthly-chart when it comes to pin pointing the exact entry point.
But I want to share just three monthly-charts that could give you ideas of where these stocks might be going looking at the long-term perspective.
First, we must understand that the most basic idea of technical analysis, that the idea of "old-resistance becoming new-support", and when that new-support becomes a "confirmed" support, that's when the powerful move can commence; which I would like to describe it as an "inauguration of a the primary-term uptrend".
Once the primary-term uptrend is established and cultivated, it can very well last for years (I mean YEARS!), and it won't be easily dismantled without the proper topping pattern.
Today, it seems like everyone is complaining about how so many stocks are in "high valuation" or "extended" or "overbought"; however, these stocks I am going to present to you are not in that category as you will see in the charts below.
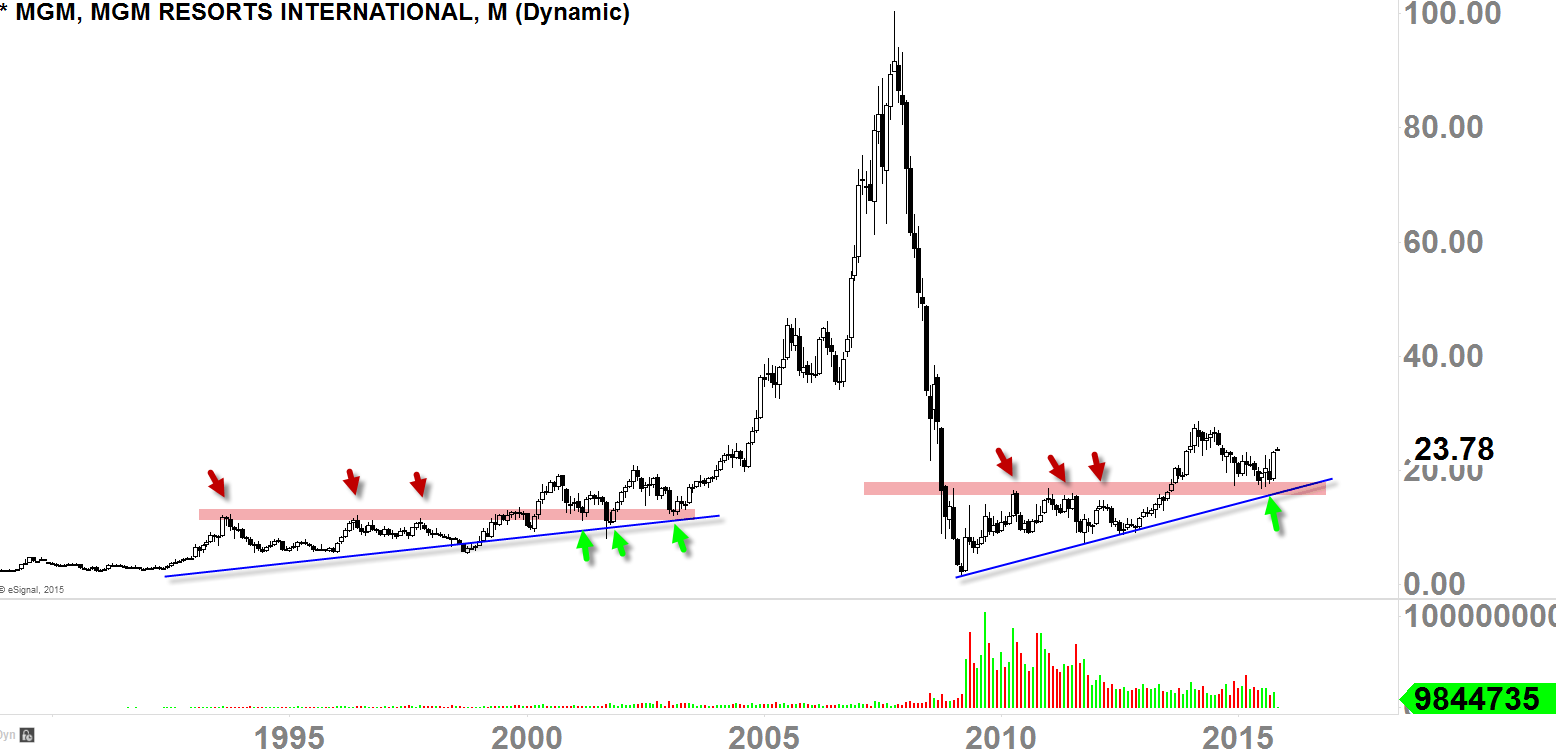
MGM Resorts International (N:MGM)
After the major crash in 2008-2009, MGM bottomed in 2010 and stayed in the "accumulation" phase (aka "Stage 1") for about 4-years before it started to breakout around 2014.
What we have to understand is, that the "breakout" itself can be very difficult to predict because we all know that the trend does not establish with straight-up move and there coule always be traps, so what does stocks do? It pulls back down to the "old resistance" level for a retest.
This stock did that mid to late this year and currently bouncing back up. I can't say that MGM is ready for a 'trip to the moon' right now, but what I can say is, that as long as the buyers can protect that $15-$18 level, the true power-move might be in stored in the long-term perspective if we can confirm the bounce on that support.
Broadcom Corp (O:BRCM)
Same scenario here: $45-level must be protected for a continuation to the upside.
Currently, the price-action is in "retesting" phase meaning we are now retesting the old-resistance as new support. It's "testing" so we must confirm the bounce before concluding that the price is going higher, which we haven't seen much as of today.
Once we can confirm the bounce right on that new-support level (green arrow), primary-term uptrend development might be on it's way looking at a long-term perspective. 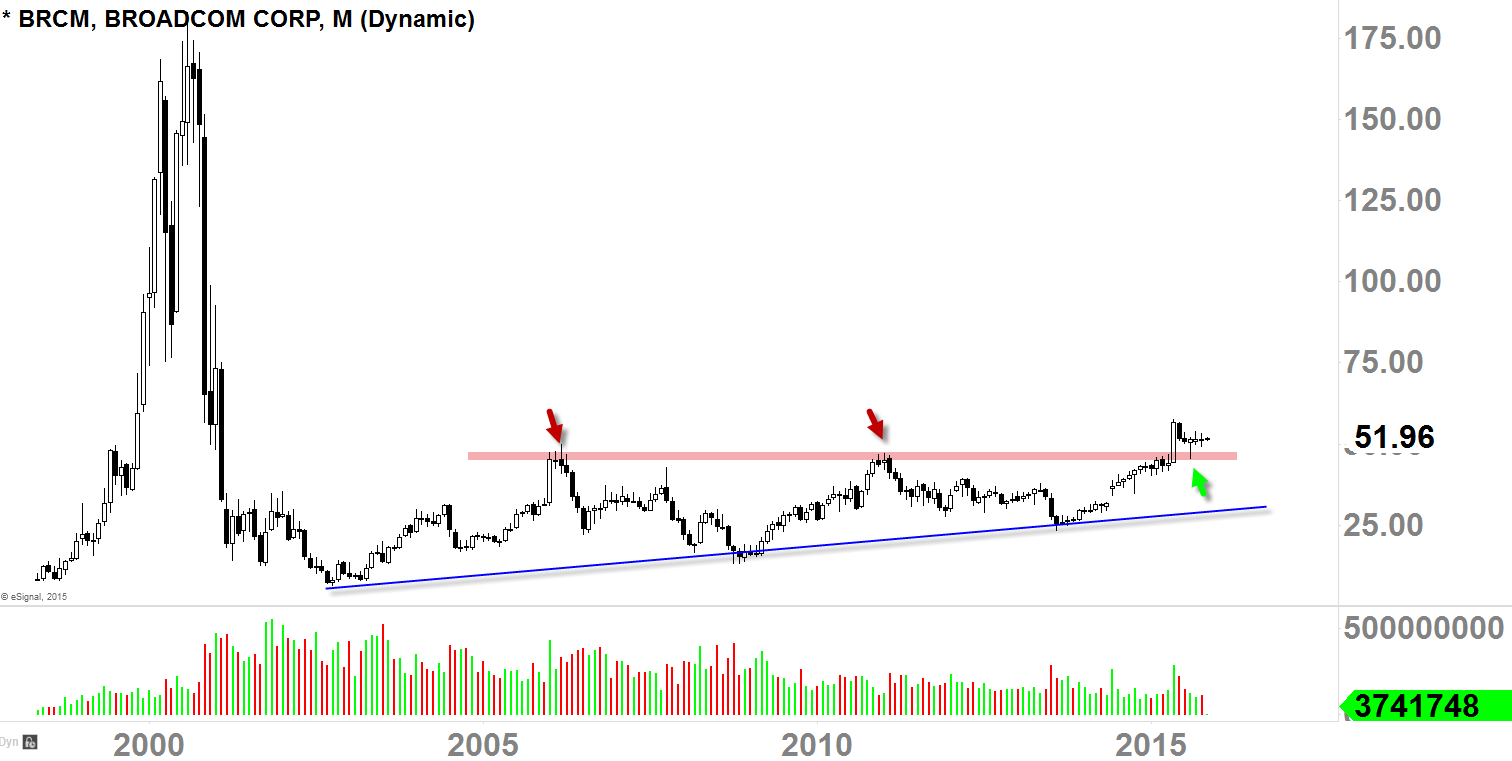
Texas Instruments Incorporated (O:TXN)
It looks like TXN has found support in $40ish-level, and finding buyers last few months as the price is now back at the recent highs at $59ish. So unlike the MGM and BRCM, this stock has progressed to the upside and now retesting the previous highs again.
We may or may not fall from this level, but I would not engage right now, but rather wait and see how it's going to deal with this level first. Long-term outlook is still very much attractive, but in the event that the price falls back down to $40ish-level, we want to see $35-$40 level holding and bouncing back up to keep this move resuming back up.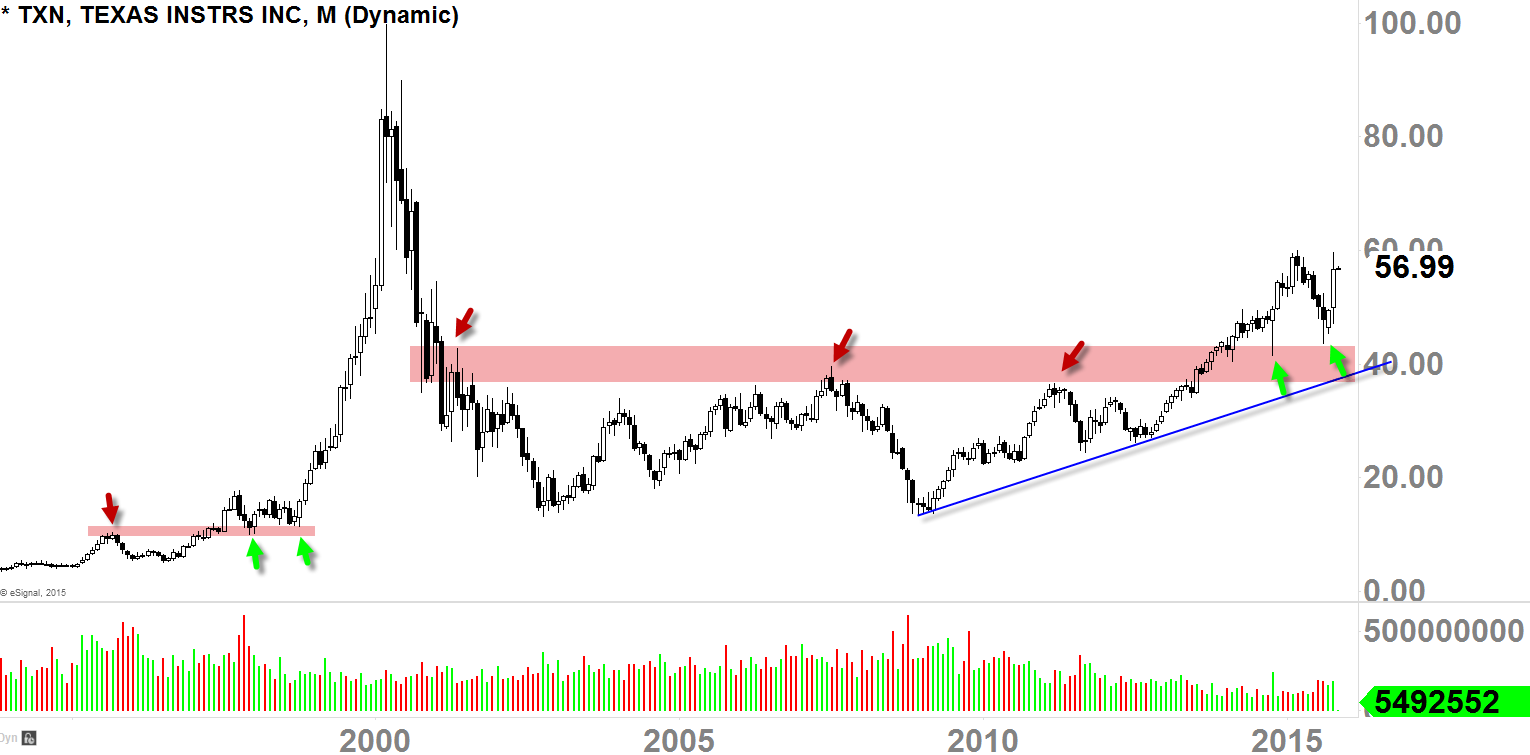
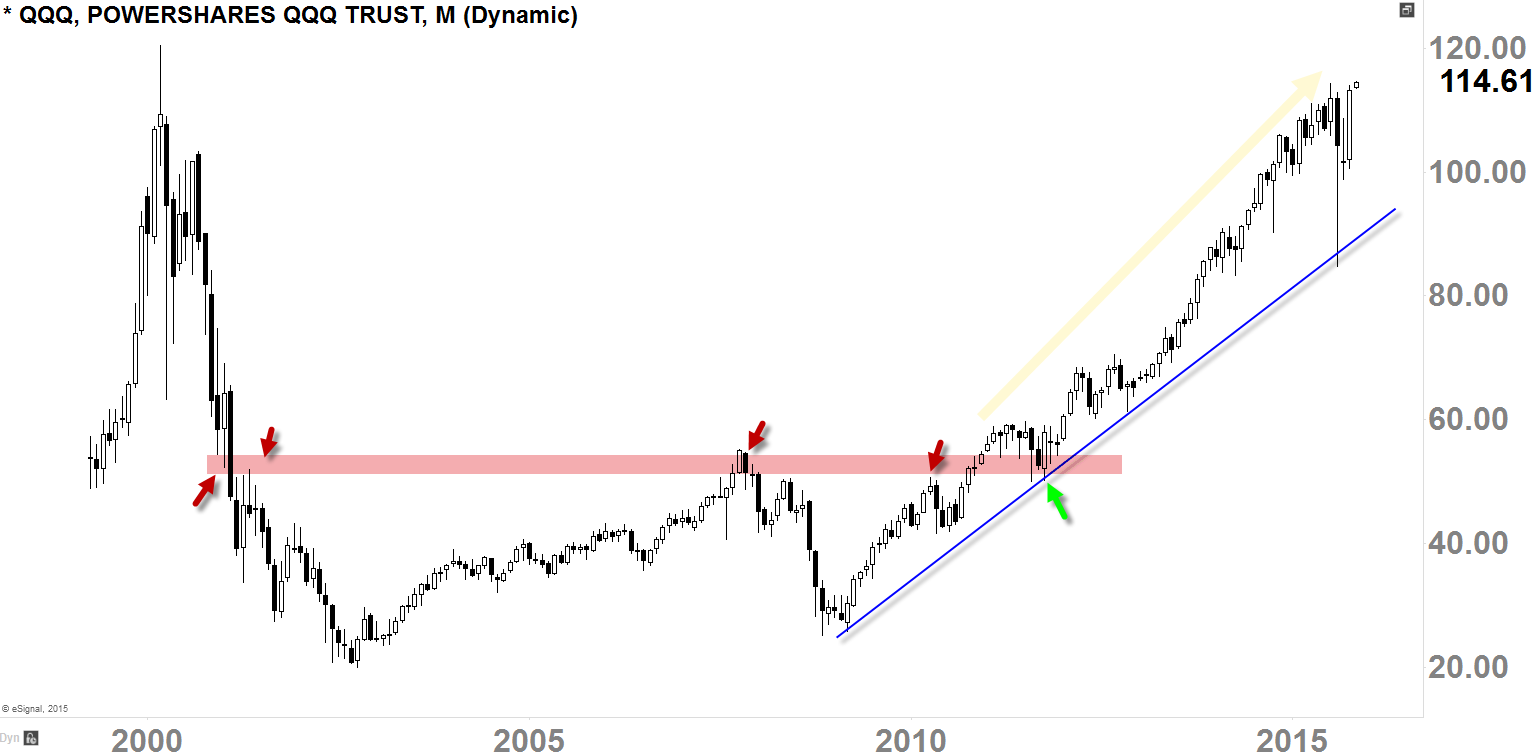
Why Important (QQQ)
Since the crash in 2000, QQQ was in a long consolidation/accumulation phase from 2000 - 2010. That's whopping 10-years!
In early-2012, it finally broke above the resistance-level (red arrows), and in late-2011, it came down to retest that level as new-support (green arrow).
Once the bounce was confirmed right on that new-support area, it got into a strong bullish uptrend for 4-years, and that's a strong bullish move! That's what we call, "Public Participation (Stage 2)".
- MGM, BRCM, & TXN all have very similar price-pattern sentiment occurring, and I am proposing the high possibility of that "Public Participation (Stage 2)" phase coming into these names