Earnings season is a quarterly ritual with much fanfare and little consistency. Here is what I mean with ‘little consistency.”
No rules
If you had known prior to the earnings release that Tesla (NASDAQ:TSLA) would report record earnings and a 74% surge in revenue - handily beating expectations - would you have bought or sold TSLA?
Despite it’s earnings beat (announced Monday after the bell) TSLA closed 4.5% lower on Tuesday.
If you want to invest based on earnings you have to predict two factors correctly:
- Whether earnings will beat or disappoint
- How the stock reacts to earnings
I’m not good enough to predict the unpredictable, so I don’t. For full disclosure, I recommended to short TSLA at 770 on Apr. 14, of course without knowing what earnings would be like. I’m certainly not the ‘earnings whisperer,’ but here are two more earnings and valuation observations you may find interesting.
When earnings come full circle
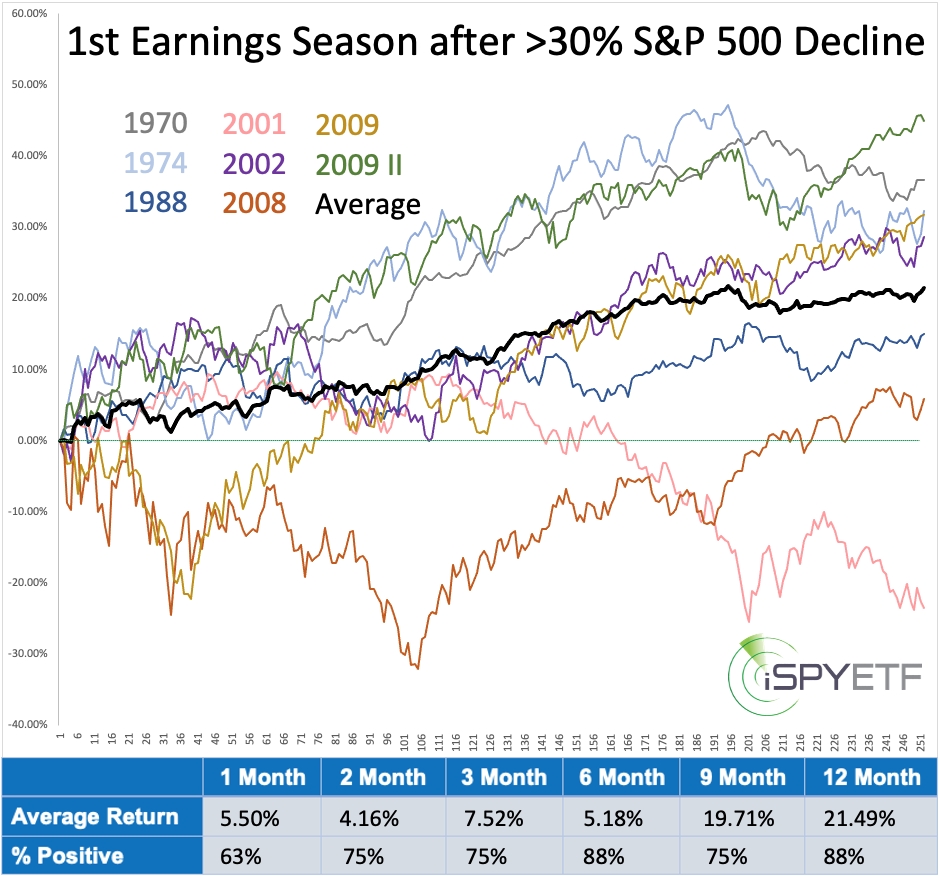
As we all know, in 2020, the S&P 500 lost some 35%. When that happened, I wanted to find out how the S&P 500 performed starting with the first earnings season after a 30% drop.
The chart below, first published on 4/12/2020, does just that. It graphs out S&P 500 performance for the 12 months following the signal date. The signal date is the first earnings season after a 30% S&P 500 drop. As the table at the bottom shows, average forward performance was clearly bullish. 
With a full year in the rear view mirror, it’s a good time to both review and look ahead.
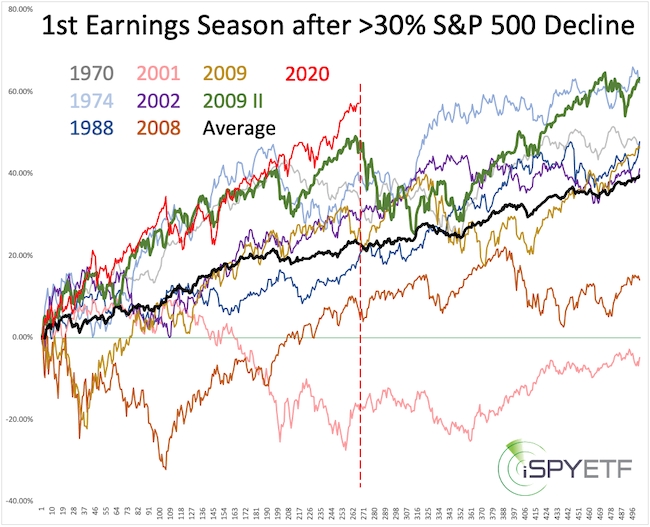
The next chart includes S&P 500 performance since April 2020 (red graph) and it extends the S&P 500 forward performance from 1 year to 2 years. The dashed red line shows where we’re at right now. 
As the red graph shows, S&P 500 performance following the 2020 signal date has been ‘off the charts,’ exceeding even the most bullish precedent (the second signal in 2009). But, even the most bullish precedent took a breather right about now. The average performance essentially flatlined throughout May and June.
In short, if history is any guide, stocks are at risk of a pullback within a longer up trend.
Valuation surprise
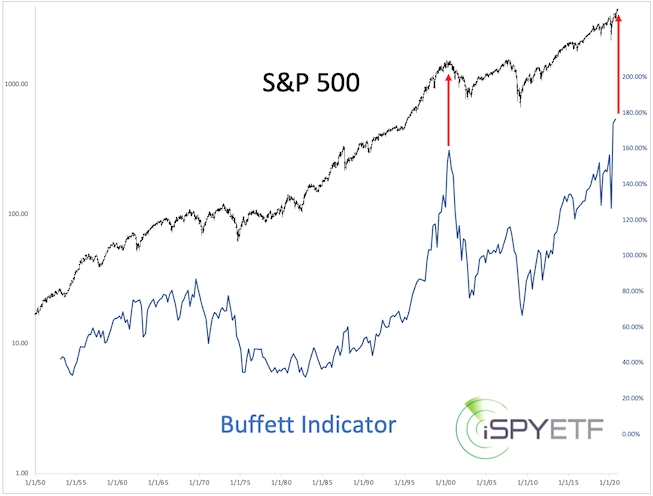
There are many valuation metrics and by most of them stocks are severely over-valued. Here’s a look at one of them, the ‘Buffett indicator’ (ratio of US stock market valuation to GDP) plotted against the S&P 500. 
Data goes back some 70 years and currently valuations are clearly at an all-time high. The arrow shows what happened in 2000, the last time valuations were sky high.
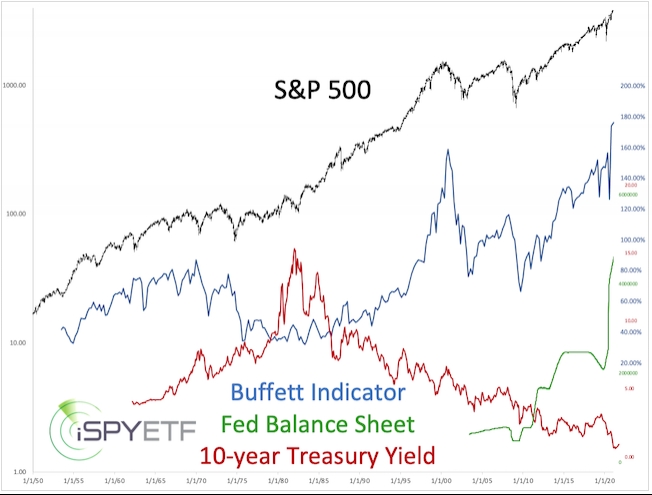
But, and that’s a big but, the above chart doesn’t tell the whole story. The chart below, published in my 2021 S&P 500 Forecast, includes two additional factors that must be considered: 
- Federal Reserve liquidity: The Federal Reserve’s balance sheet expansion has been unprecedented. The 2020 liquidity injection dwarfs even the various post-financial crisis QE packages. Extra liquidity makes its way into all assets and may stretch decade old stock market valuation benchmarks.
- Low interest rates: Near the 2000 market top, 10-year yields stood around 6%, in 2021, yield just made it back above 1% again. Unless you are willing to accept fixed returns of 0.5% or less, investors have no alternatives besides stocks and other tradeable assets.
The one-eyed king scenario
In the land of the blind the one-eyed man is king, and equities might be the one-eyed man in the desert of low yields.
In summary, despite sky high valuations, a stock market pullback into summer should turn out to be a buying opportunity.
