- Forecasters expect US existing home sales to fall for second time in May
- US equities are climbing a wall of worry, as fears grow of overvaluations
- The Turkish lira defies forecasts this year and strengthened against the US dollar
Scheduled economic reports continue to dribble out at a snail’s pace. The main exception today: the monthly update on existing home sales in the US.
Meantime, debate rages about the US stock market and whether it’s in bubble territory or not. In forex, the Turkish lira has defied expectations by rallying modestly against the US dollar in the second quarter.
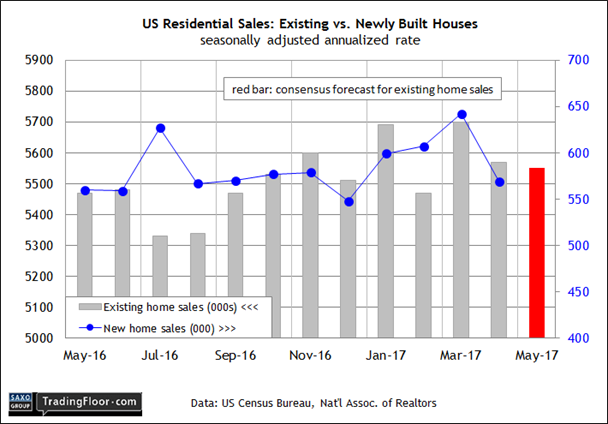
US: Existing Home Sales (1400 GMT): The housing market has been slowing in recent months. It’s unclear if this is another temporary stumble or the start of something more troubling.
Judging by sentiment in the home building industry, however, the outlook remains bright.
Builder confidence eased modestly in June, but continues to hold at a level that’s associated with a solid rate of growth, based on the Housing Market Index.
“Builder confidence levels have remained consistently sound this year, reflecting the ongoing gradual recovery of the housing market,” the chairman of the National Association of Home Builders said last week.
Nonetheless, home sales for May are expected to fall for a second month. Econoday.com’s consensus forecast sees transactions dipping to an annual rate of 5.55 million units, a three-month low.
The news follows last week’s May release for new residential construction projects, which fell to the slowest pace in eight months. Newly issued building permits also eased last month.
Economists say that a key factor weighing on construction is a shortage of workers and available land for new housing.
Whatever the reason, the headwinds aren’t especially favourable for the housing sector in the near term, as today’s data is expected to show.

US: S&P 500 Index: The US stock market seems to be defying gravity, prompting a growing chorus of warnings that equities are overvalued and the risk of a correction is elevated.
Equities may be irrationally exuberant, but the momentum profile remains bullish by more than a trivial degree.
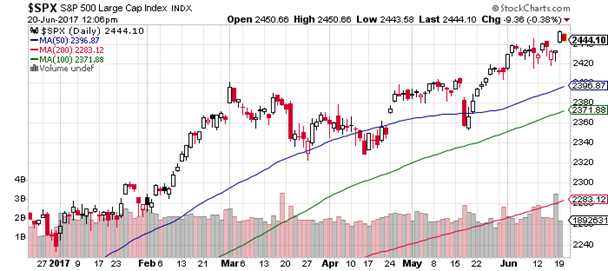
Examples include a near-perfect lineup of key moving averages for the S&P 500: the 50-day average is comfortably above the 100-day average, which far above its 200-day average.
The cherry atop this financial sundae is the S&P’s price, which closed at a record high on Monday.
The index was down fractionally in mid-day trading on Tuesday, but the bull market trend looks no worse for wear. For the trailing one-year return, the S&P is up a sizzling 18%, or more than twice its long-term average.
The enduring appetite for equity risk has some analysts scratching their heads. “"I don't know where the optimism is coming from. That's not to say we should be negative,” said the vice president of trading and derivatives at Charles Schwab this week.
“I just don't see any reason for excessive optimism or pessimism right now.”
Other strategists are warning that the potential for loss, or even a crash, is elevated. Several well-known market pundits last week told Money that trouble is brewing for the US stock market.
The next bear market, warned the chief investment officer at Forester Capital Management, is “going to be agonising”.
Deciding when the next downturn starts, however, falls into the category of a known unknown. A bear market is out there somewhere, but no one has a clue if it’ll start tomorrow or five years on.
Meantime, fear is conspicuously missing in the collective “wisdom” of pricing US stocks. At some point the party will end, but at the moment the market’s priced on the assumption that the good times will roll on for the foreseeable future.

Turkish Lira: There is rising geopolitical tension between Turkey and the US in particular, and over the past year has inspired analysts to warn that the lira is vulnerable.
Yet the currency’s appreciation against the US dollar in recent months has undercut those predictions and USD/TRY has weakened of late.
The firmer lira is even more surprising in the wake of last week’s rate hike by the Federal Reserve, the third in the last six months.
Meanwhile, Turkey’s central bank has had a mixed record in tightening policy this year, despite ongoing inflation risk and an uptick in economic growth.
The bank recently lifted the late liquidity window rate, which supplies most of the funding to commercial lenders; the main benchmark rates, however, are unchanged so far this year.
Nonetheless, the country’s 8.0% benchmark rate looks alluring next to the European Central Bank’s zero refinancing rate – a spread that makes the lira a tempting target for the carry trade (borrowing money in a lower-yielding currency and investing in a higher-rate asset).
Emerging markets generally are in favour again with investors, and Turkey’s lira is benefiting from the renewed appetite for currencies in this corner of global markets.
USD/TRY is basically flat year to date, but since the country approved a controversial constitutional referendum to extend the president’s powers in April, the lira has gained more than 5% against the greenback, as of mid-day trading on Tuesday.
The rebound for USD/TRY is striking when you consider that the currency was plumbing record lows against the dollar in January, which followed a 16% dive for the lira in 2016, a year when several credit-rating outfits cut the country’s bonds to junk status.
The outlook for the currency at the start of the year was grim. The only solution to stabilise the collapsing lira, some economists advised, was a dramatic hike in Turkey’s interest rates.
But the central bank has kept the main rates steady while the bearish forecasts have been upended so far in 2017. Will the lira continue to strengthen in this year’s second half?
The technical signals are mixed, although there’s a case for cautious optimism for the currency's bulls.
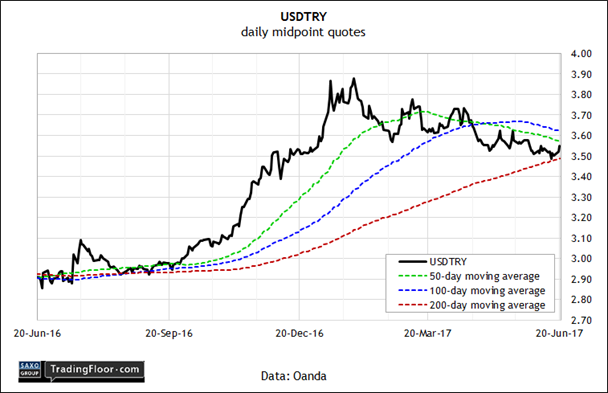
USD/TRY is trading below its 50-day average, which fell below the 100-day average earlier in the year (lower values of USD/TRY equate with a stronger lira).
More recently, USD/TRY bounced off its 200-day average. But the downtrend looks intact.
If USD/TRY can break and hold below the 200-day mark, the bullish outlook for the formerly battered lira will brighten for remainder of 2017.

Disclosure: Originally published at Saxo Bank TradingFloor.com
