I’m normally an optimistic, “glass-half-full” kind of guy. I roll my eyes every time I see a headline decrying the next market crash or cataclysmic event that will cripple the global economy. I’m quick to discern speculation from truths and prefer taking the opposite side of most mainstream assumptions.
It’s not that I see everything through rose colored glasses, but rather that I have found an unruffled approach to be a strong foundation for better decision making. Navigating the markets with a calm and calculated strategy produces far superior returns than simply worrying about what dangers might lurk around every corner.
That being said, there are always areas of risk that I have my eye on. It’s beneficial to know both where the market is showing its strengths and where weakness can undermine those positive qualities. There are currently three charts that are demonstrating worrisome price action that I have categorized as red flags.
Energy Select Sector SPDR (NYSE:XLE)
XLE is the largest and most well-known energy sector fund with $16.6 billion under management. It tracks a basket of 35 large-cap oil and gas companies that derive their profits from exploration and refinement of liquid commodities.
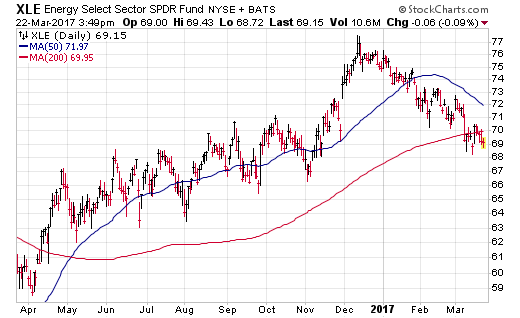
Examining the chart below, it’s obvious that XLE peaked in December 2016 and has been on a slow descent ever since. This index also just recently crossed below its long-term 200-day moving average, which may indicate the start of a new downtrend as crude oil prices touch new year-to-date lows.

From high to low, XLE is down approximately 10% and has been trading in an orderly manner. However, the decoupling from the rest of the market that recently hit new all-time high is a concerning factor that should be noted.
Energy only makes up roughly 6.5% of the broader S&P 500 Index. Nevertheless, the fluctuations in global commodity prices have been known to start ripple effects through other areas of the economy as well.
SPDR S&P Retail (NYSE:XRT)
By now we have all heard or seen about how Amazon.com Inc (NASDAQ:AMZN) is taking over the world of consumer spending. Online commerce has continued to thrive and the death of traditional shopping malls is another fear that has pervaded consumer circles as well.
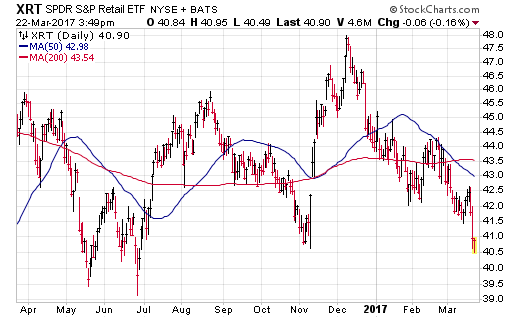
Looking at a chart of XRT, it’s not hard to see that investors are agreeing with much of that sentiment. This ETF tracks an equal-weighted basket of 100 retail stocks across food, drug store, apparel, and specialty goods segments.

This fund just recently hit new year-to-date lows and breached the November 2016 “election low” as well. The weakness in retail stocks should be notable in that consumer surveys demonstrate continued optimism in the economy. However, that confidence is not being returned in the share prices of many major national retailers.
My guess is that we will eventually see a swinging of the pendulum back to brick and mortar retailers, but for now the trend continues be one of choppy prices and overall weakness.
iShares Nasdaq Biotechnology (NASDAQ:IBB)
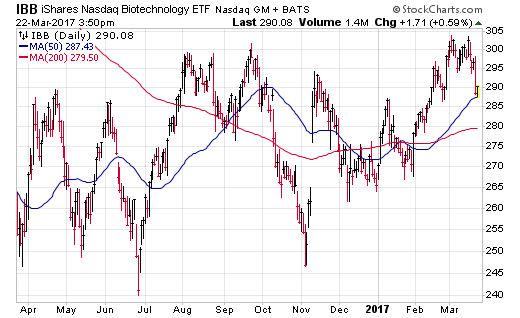
Speaking of choppy, you don’t see much more evidence of extreme whipsaws than in IBB. This exchange-traded fund tracks 160 large and mid-cap biotechnology stocks in a market cap weighted approach. It’s chart patterns suggest a high degree of indecision over the direction of the industry altogether.

The big jumps and sharp drops in IBB over the last year have created a very messy trend. This type of price action may benefit short-term traders. However, it is a frustrating pattern for trend followers and other long-term investors.
There is a fair amount of political risk that is taking its toll in the health care sector right now as well. This ambiguity is creating additional volatility on both sides of the tape that may persist for some time in the future.
Yes, IBB is still positive on the year, but shareholders should be wary of the higher risk than other areas of the market.
Yellow Flags
Two other notable areas of diverging momentum on my radar are small cap stocks and the financial sector. The iShares Russell 2000 (NYSE:IWM) and Financial Select Sector SPDR (NYSE:XLF) are two key examples. Both made a strong post-election push that has started to wane in recent weeks. This tailing off may simply be the result of some sector rotation giving the leaders a break or it may be a cautionary signal of more weakness to come.
The churning in all these various market segments highlights the hit-or-miss style of sector investing versus choosing broader indexes for the bulk of your investment assets. My preference is to use more diversified indexes for core exposure and then supplement those positions with select tactical themes when appropriate.
Disclosure : FMD Capital Management, its executives, and/or its clients June hold positions in the ETFs, mutual funds or any investment asset mentioned in this article. The commentary does not constitute individualized investment advice. The opinions offered herein are not personalized recommendations to buy, sell or hold securities.
