US corporate profits rose to a new high in 2Q18, but prior quarters were revised lower by $739 billion.
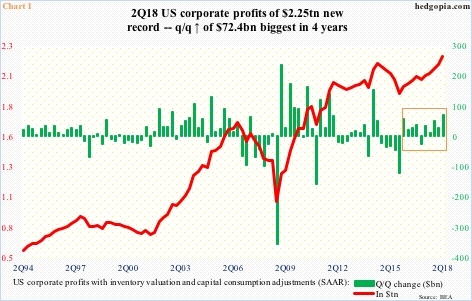
Second-quarter US corporate profits were published Wednesday. Profits adjusted for inventory valuation and capital consumption rose 7.7 percent year-over-year to a seasonally adjusted annual rate of $2.25 trillion – a new high. This has been quite a recovery.
After suffering five straight quarters of quarter-over-quarter decline during 4Q14-4Q15, profits posted sequential increase in 1Q16. (US stocks reached a major bottom in February 2016.) Since then, there has only been one down quarter – in 1Q17 (box in Chart 1). The 2Q18 q/q increase of $72.4 billion was the highest in four years.
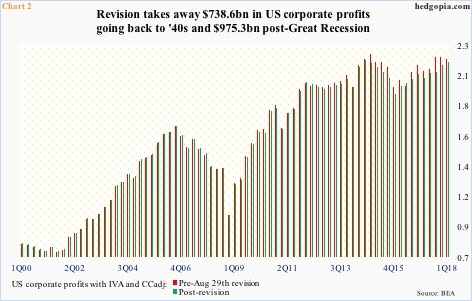
But there is a twist in all this. Profits in prior quarters were revised lower, substantially in some quarters.
The pre-revision high of $2.23 trillion from 4Q14 was revised lower by $64.1 billion to $2.17 trillion. The pre-revision second highest ever of $2.21 trillion in 3Q17 was lowered by $112.5 billion to $2.1 trillion (Chart 2). The revision went all the way back to the ’40s, but it was meaningful beginning the late-’80s. All told, corporate profits were revised lower by $738.6 billion. Beginning 3Q09, which is when the current economic expansion got underway, profits were revised lower by a whopping $975.3 billion.
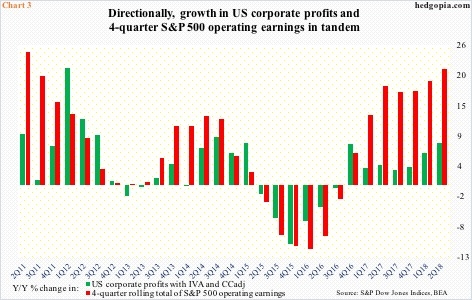
The revision in corporate profits brings it more in line with S&P 500 operating earnings (Chart 3). Directionally over the long term, the two tend to move together, with sporadic divergence here and there. Going back four years, there has not been one. Of course, the growth rate in S&P 500 operating earnings is much higher than in corporate profits.
In 2Q18, for instance, the four-quarter rolling total of S&P 500 operating earnings jumped 21.2 percent y/y to $140.44, versus the aforementioned 7.7 percent for corporate profits. This pace of growth in S&P 500 operating earnings is simply unsustainable. That said, the sell-side continues to exude confidence for the remainder of this year and next.
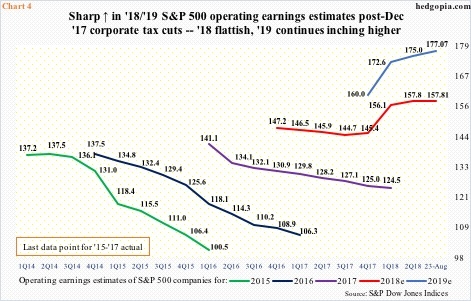
As of last Thursday, consensus estimates for 2018 were $157.81, slightly down from $158.24 about a month ago. Estimates this year are beginning to show a flattish to slightly down tendency (Chart 4). Nevertheless, if these estimates come through, earnings would have grown 26.7 percent over 2017. This comes on the heels of 17.2-percent gain last year. As things stand, 2019 will decelerate from this year’s pace, but is still expected to grow 12.2 percent to $177.07, which is down ever so slightly from $177.13 three weeks ago. It is customary for these analysts to start out optimistic and then gradually bring the numbers down as time passes. In all probability, 2019 will evolve this way – if nothing else just to narrow the gap between corporate profits and S&P 500 operating earnings. The gap the past several quarters between the red and green bars in Chart 3 is simply too wide to sustain.
Thanks for reading!


