The U.S. markets have been in a prolonged multi-year topping formation. Having lulled investors to sleep and crashing volatilities, recent years' U.S. market history has rewritten what the late great Richard Russell meant by Random Walk.
Previously, it referred to the industrials being alone at new highs after the transports and utilities had already peaked. Today, the meaning of Random Walk is far more ominous, I believe. Many global equity markets topped years ago, either on cyclical or even secular bases....except for the U.S.
What follows is an abbreviated look at why the trends may have found their limits according to the 4 popular forms of analysis: fundamental, valuation, technical and quantitative.
Based on these, we may conclude why, at the bare minimum, precious metals and their stocks are set to outperform versus global equities....and perhaps substantially.
FUNDAMENTAL
Economic growth used to refer to an improving business climate accompanied by increasing availability of investment capital for new products and services coming into the marketplace.
During this cycle, however, and to a meaningful extent, it has meant cannibalization of global economic growth in favor of U.S.-based multi-nationals, thereby inflating U.S. corporate growth, while international investors funnel equity investment into the one market that has held up.
This has created the possibility for a global domino effect, tipped by any of the four equity price determinants, or what transpires in any of the other major markets, since the weight of foreign stock liquidation could always be the straw that breaks the equity market's paper-based back.
Both monetary and fiscal stimuli expand price:earnings multiples, and, longer term, each has a similar effect on the relative valuation of precious metals versus equities. Each also has the capacity to play the role of a bull trap and means to an equity blow-off.
The last card has been played and, with it, came the blow-off in the overvaluation of precious metals versus global equities.
VALUATION
The biggest sustainer of madcap valuations has been zero interest rates, since the latter has allowed for heretofore unseen valuations for earnings.
Lost on many is the acknowledged fact that the interest-rate cycle has bottomed and that higher rates are a matter of course therefore, regardless the number of delays in the latter's uptrend.
The upshot is that with each uptick, apart from any effect that such interest rate increase may have on the economy and earnings, the price earnings multiples must contract.
Therefore, the slightest of rate increases contains within it a disproportionate risk of equity price devaluation.
Put another way, even assuming unchanged earnings, prices could decline substantially with even a moderate decline in the price:earnings multiple, which is so heavily leveraged to it zero-rates paradigm.
TECHNICAL
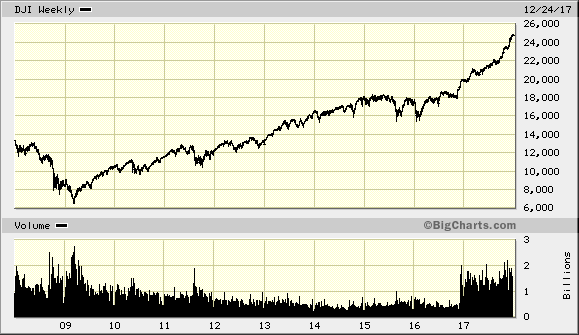
Arguably, a 5-wave advance from the March 2009 Dow trough is completing, after having already surpassed the customary time duration before a significant correction.
Waves 2 and 4 bottomed in the 4th quarter of 2011 and the beginning of 2016, respectively, and the 2-year 9000-point wave-5 advance may be ending now, including a ~5000-point blow-off from 2017's 1st-quarter low.
More than half of the 9-year advance occurred in 2017, and, according to Wave Theory and my own 35-years of experience, since an initial major market correction tends to decline to the area of the previous wave-4 of larger degree, which is the 18,000 - 20,000 zone, 5000 Dow points could disappear with relative speed. (Please see 10-year Dow chart immediately below.)

All along, technicians have worried about the fact that the customary parabolic blow-off had not yet occurred. As the preceding indicates, they need worry no longer. Fiscal stimulus and year-end window dressing have accommodated.
Internationally, while various markets peaked years ago, even when looking at major Asian markets that topped many years ago, we see that the Nikkei only broke the 2015 high in 2017's fourth quarter.
Looking at the Nikkei going as far back as 30 years, that index makes a time cycle extreme at the end of the calendar year. (Time cycles indicate the conclusion of buying or selling pressure, though actual prices may continue a little bit farther in the same direction.)
I use the Nikkei as a guideline for gauging the timing of turning points in relation to global equity indices.
Similarly, silver makes a time cycle extreme every December and it usually bottoms after gold, before greatly outperforming it. Initially, major investors focus on liquidity (gold), before the attraction to leverage turns investor favoritism toward silver.
I use silver as a guideline for the timing of precious metals, in general.
Therefore, gold and the Dow are not points of focus for timing purposes, but are integral for later engineering optimized and strategic profit opportunities.
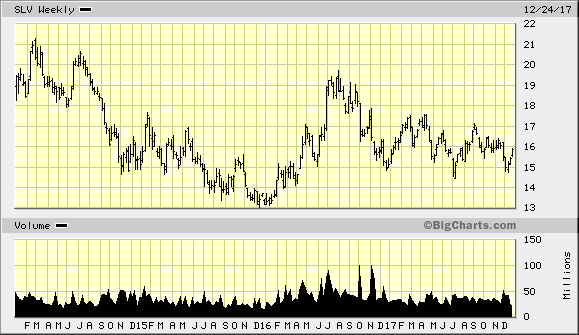
Indeed, gold made a new year-high in August, while silver continued lower until 2017's year-end, before a sharp $1 reversal over these past 2 weeks.
With points in November 2014, January 2016 and July 2017, silver shows a large reverse (bullish) shoulder-head-shoulder pattern.
Similarly, within the latter's right shoulder, there exists a reverse shoulder-head-shoulder pattern, with the corresponding price points having taken place in December 2016, July 2017, and this past month. (Please see 4-year SLV chart immediately below.)

QUANTITATIVE
One of the best gauges of sentiment is volatility premiums, but going one step father is the analysis of what the market is paying for time on percentage bases, whether looking at equities or precious metals.
Simply, if, in percentage terms, one is not paying much more for very long term premiums than for shorter term premiums, then that flatter curve is not only representative of a too-sanguine attitude in the marketplace, it also illustrates a very unique and profitable opportunity for those using longer dated strategies.
This is particularly the case for those seeking to benefit from the outperformance of precious metals versus global equities, since these asset classes' premiums are also not presently priced to reflect the asymmetric very long term relationship between global equities and precious metals.
To further fatten the opportunity, albeit temporarily, both the equity and precious metals volatility indices are at historic bargain basement levels. These compounding factors have again created extreme hedging and profit opportunities.
These factors, all taken together, perhaps represent once-in-a-lifetime opportunity.
Of course, I said that in 2007 - 08 and 2000 and I was proven wrong, since here we are in the same lifetime.
CONCLUSION
To appreciate what investors will do in response to 2018's challenges, let us consider the questions that they will have asked themselves on how to be positioned to protect one's wealth.
What happens when there are less taxes being collected on a smaller revenue base that results from of a slower economy?
Within a new interest rates uptrend, would higher earnings multiples result in higher precious metals prices since the latter requires no revenue to be solvent?
Simply, as we venture into 2018, should investors not be positioned to hedge against, and benefit from the extreme financial, economic and political risks that exist in the world today?
After all, the reason why volatilities are at historically cheap levels is because investors have forgotten 2008 and all the other times worth remembering. On each occasion, such investors acted as if they were thinking, "Well it hasn't happened yet, so why worry?"
Of course, no one will confess to having ever actually thought that, but they acted as if they did, and this time is not only no different, but today is the worst example of all carelessness, past or present.
For the strategic purposes of wealth protection and enhancement, let us carefully examine the findings in the quantitative section immediately above.
Act with prudent foresight before 2018 has a chance to age.
