There are 20 elite closed-end funds (CEFs) that have proven their toughness in the last 10 years (including through the Great Recession, the most brutal test of all) and have still handed investors market-beating returns.
And below we’re going to look at all 20 of them.
So if you’re looking for a proven dividend payer that will hold its own through today’s troubles—trade wars and rising interest rates, to name just two—these 20 funds are a great place to start.
The Toughest of the Tough
Some of these cash machines throw off dividends of 6.8% or more (and one I’ll tell you about in a moment pays a sky-high 12.4%!). When I say they’re proven, I mean it: many of have handed investors annualized returns upwards of 12% without sacrificing safety.
Let’s start with the 8 “new” funds on our top 20 list, by which I mean any fund less than a decade old. I’m choosing that time frame because the Great Recession started about a decade ago, so these funds haven’t been tested by the most challenging economic crisis in nearly a century.
Still, their performance is nothing to sneeze at.
Take a look at the chart below, which shows not only these funds’ market price, but also their net asset value (NAV), which is the true intrinsic value of the assets these funds hold. Note that some of these are trading at premiums to their NAV, and some are at a discount.
Stunning Returns Up to 20% a Year
The top performer by far is the tech-focused BlackRock Science & Technology (NYSE:BST), with an incredible 20.1% annualized return over the last 3.5 years.
Of course, tech hasn’t been doing well in 2018 due to controversies at Facebook (NASDAQ:FB) and Alphabet (NASDAQ:GOOGL), which are top holdings in BST. Similarly, the tech-focused Columbia Seligman Premium Technology Growth Closed Fund (NYSE:STK) also holds these and other tech stocks, and it’s had an impressive 12.5% average return for over eight years.
Now that tech is hurting, the market is abandoning these and other tech-focused funds—even though both are proven performers, having beaten the “dumb” index fund for tech, the Technology Select Sector SPDR ETF (NYSE:XLK).
Good Funds Get Punished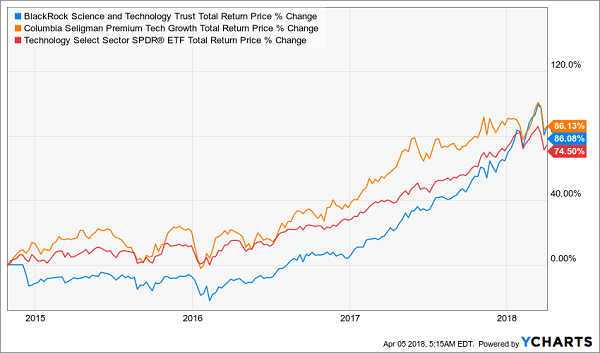
This is a perfect example of the headline “noise” casting a shadow over well-run funds. If you’re an income investor looking for a long-haul investment, put STK and BST, with dividends of 8.4% and 5.2%, respectively, high on your list.
For even higher dividends, look to the Western Asset Mortgage Defined Opportunities Closed Fund (NYSE:DMO), with an incredible 10.0% yield, and Rivernorth Opportunities Fund Inc (NYSE:RIV), with an even more incredible 12.4%! Both hold a variety of corporate bonds and other high-yield investments that yield income, which the funds pass on to investors. Their strategies have been working; both are beating the S&P 500.
2 More Yield (and Growth) Stars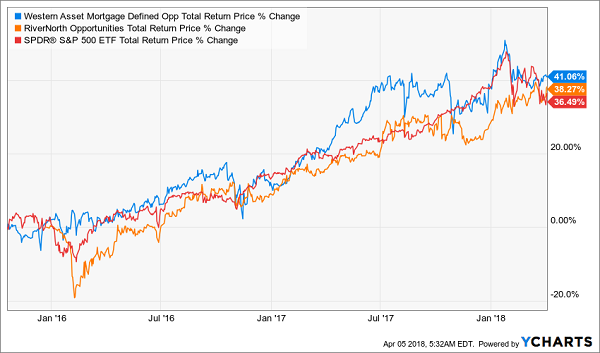
I should also mention that if you’re willing to take on a little more risk in return for a strong total return, all of the 8 funds in the table I showed you above are worth serious consideration. For international exposure you have the India Closed Fund (NYSE:IFN) and Aberdeen Japan Equity Fund Inc (NYSE:JEQ); for diversified bond holdings you can buy DMO, RIV, and the Pimco Dynamic Income (NYSE:PDI); and you can get stocks with BST, STK and the Nuveen S&P 500 Dynamic Overwrite Fund (NYSE:SPXX).
The Dependable Stalwarts
If funds with only a few years of history under their belts seem too risky for you, no problem—let me show you 12 CEFs that have an entire decade of beating the S&P 500, year in and year out, even during the 2007–09 meltdown.
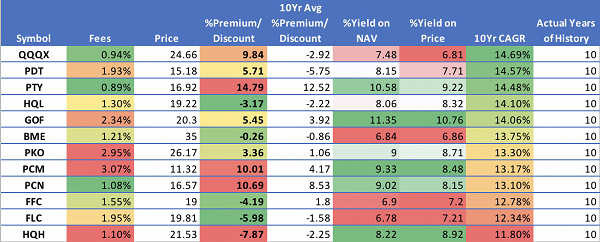
The big winner is, again, a tech fund, the Nuveen NASDAQ 100 Dynamic Overwrite Closed End Fund (NASDAQ:QQQX), which combines a focus on tech with an income-investing strategy to sustain a 6.8% yield. That winning combination has also provided near 15% annualized returns for over a decade—which is almost identical to the more familiar PowerShares QQQ Trust Series 1 (NASDAQ:QQQ), which tracks the Nasdaq 100.
Matching the Index—But With a Lot More Cash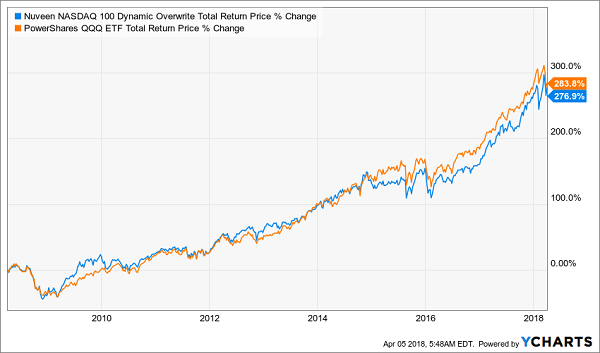
Why choose QQQX over the index fund? The answer is simple: while QQQ locks in almost all of your return in capital gains, income investors are stuck with a measly 0.8% dividend yield. But with QQQX, you get the strong gains from tech and a fat 6.8% yield at the same time.
For more outperformance, check out the healthcare-focused Tekla Life Sciences Investors (NYSE:HQL) and Tekla Healthcare Investors (NYSE:HQH) funds. These index busters offer yields in excess of 8% apiece, with a strong track record. But something really interesting is happening now that makes HQH particularly attractive.
Beating the Market—Until Now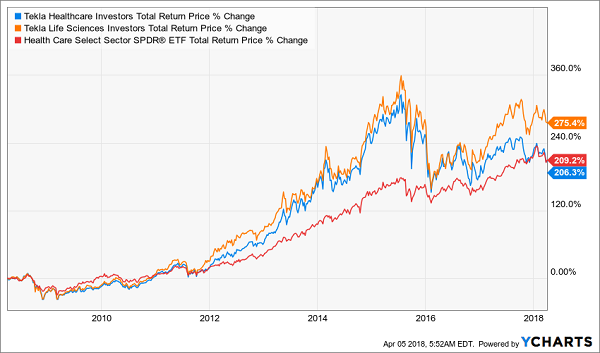
HQL (shown in the orange line above) now sports a narrower discount to NAV of 3.2%, compared to 6% just a few months ago, which is helping it continue to outperform the index.
But a sudden drop in the discount of HQH (the blue line above), to 2.2% makes the fund look like it’s falling behind (it was trading at a 3.1% premium less than a year ago). But HQH crushed the index until recently and will likely do so again soon.
In addition to these 3 strong equity funds, the John Hancock Premium Dividend Fund (NYSE:PDT) and the BlackRock Health Sciences Trust (NYSE:BME) provide even further equity exposure with a long index-beating track record and around 7% yields, on average, per fund.
Then add together PIMCO Corporate & Income Opportunity (NYSE:PTY), Guggenheim Strategic Opportunities Closed Fund (NYSE:GOF), Pimco Income Opportunity (NYSE:PKO), Pcm Fund (NYSE:PCM) and Pmco Corporate & Income Strategy (NYSE:PCN) for diversification across literally thousands of different bonds.
Let’s finish off with two of the best preferred-stock funds on the market—the Flaherty & Crumrine Preferred Securities Income Fd (NYSE:FFC) and Flaherty & Crumrine Total Return Fund Inc (NYSE:FLC) funds.
Where does that leave us?
With an extremely diversified portfolio of CEFs holding common stocks, bonds and preferreds that has been crushing the S&P 500 for a decade, pays an outsized 8.0% average dividend yield—and is set up for more outperformance.
Just Released: The 8.2% Dividends Wall Street Hides From You
Just a week ago, I released my 5 hottest CEF picks—and I want to show them to you now.
They have a lot in common with the 20 funds we just discussed, but with one crucial difference: they’re not simply funds to consider now—they’re the top 5 names I urge you to buy right away!
Each of these funds 5 unsung CEFs throw off safe, and massive, dividend payouts—I’m talking an average 8.2% in CASH, with one of these beauties even handing you an outsized 10%.
Imagine what that would do for your retirement portfolio.
That’s not even the best part, though.
This is: each and every one of these 5 CEFs trades at a massive—and totally unusual—discount to NAV that simply can’t last.
The bottom line? We’re looking at easy 28%+ upside in the next 12 months.
To put that in dollars and cents, putting $400,000 into these funds today would immediately kick-start a $32,800 yearly cash stream. PLUS you’d be set up for a nice $80,000 in price gains too.
And because you’re getting most of your return in CASH, you’ve got some nice insulation from volatility here.
Wall Street: “Pay no attention to the man behind the curtain”
Funny thing is, you won’t hear a whisper about these 5 obscure wealth builders from Wall Street. They’d much rather steer you into an ETF, like the SPDR S&P 500 ETF (NYSE:SPY), an “automatic” fund that simply tracks the benchmark index (or maybe one of the tech ETFs I mentioned earlier).
It’s a lot easier for them, because they don’t have to do a smidgen of research, and they get paid anyway.
That’s great for them, but terrible for you.
Because if you follow their “advice,” you’ll be stuck “grinding it out” on the pathetic sub-2% dividends many ETFs dribble out today. And you’re still exposed to the stomach-churning market swings we’ve seen since the beginning of 2018.
That’s no way to fund your retirement, and it’s exactly why I rolled out these 5 incredible 8.2%-paying CEFs now.
I can’t wait to show them to you. All you have to do is CLICK HERE to get instant access to the name, ticker symbol, buy-under price and my complete research on every single one of these 5 cash machines!
Disclosure: Brett Owens and Michael Foster are contrarian income investors who look for undervalued stocks/funds across the U.S. markets. Click here to learn how to profit from their strategies in the latest report, "7 Great Dividend Growth Stocks for a Secure Retirement."
