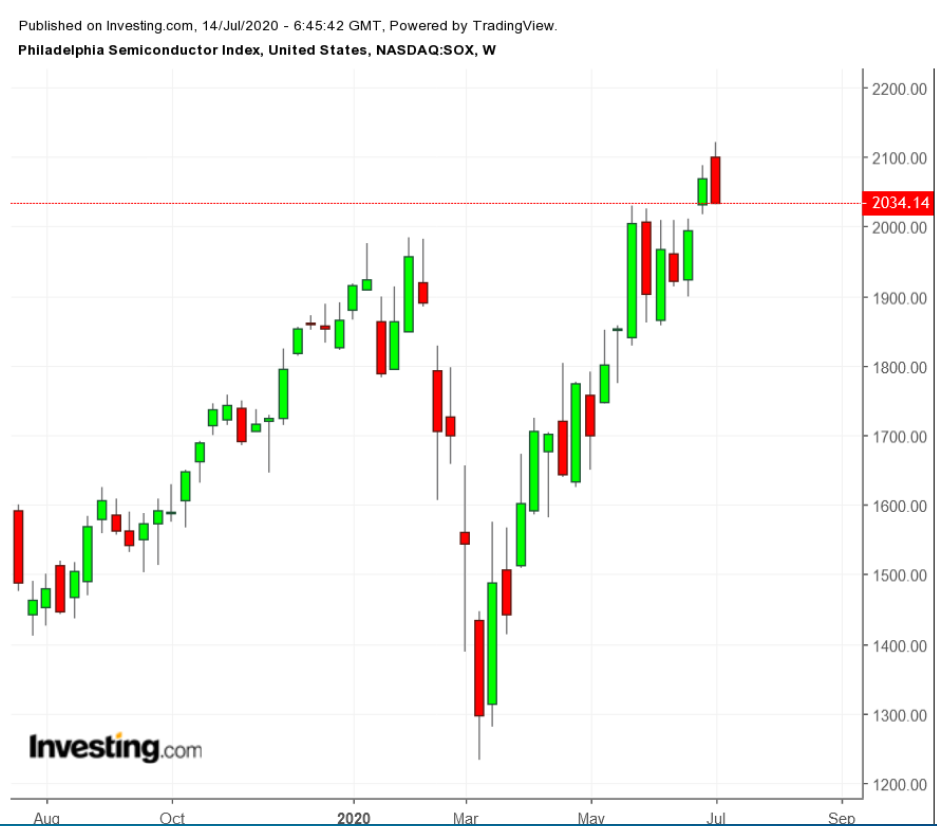
During the bull run of the past decade, semiconductor stocks have been essential drivers of the broader technology sector's upside. Although initially, they were among those shares that sold off rapidly during the COVID-19 triggered selloff during February and March, most chip stocks have had a remarkable comeback since hitting 52-week lows in late March.

So far in 2020, the widely followed Philadelphia Semiconductor Index is up close to 10%. Therefore in this post we'll consider what long-term investors might expect from the semiconductor industry in the coming months. As well, we'll introduce two sectoral exchange-traded funds (ETFs) that deserve to be on any investor's radar screen.
Semiconductor stocks are cyclical
Semiconductors are the brains inside electronic devices. Chips are used in a wide range of products in computing, telecommunications, gaming, transportation, military systems, and healthcare. They are typically behind technology innovation. As a result, shares of semiconductor companies usually act as a bellwether for the technology sector as a whole.
Note however that the semiconductor industry is cyclical. During periods of high demand, upturns occur. There may also be supply shortages, leading to higher prices and revenue growth. Thus profits of chip companies may ebb and flow dramatically. It's never easy to know whether the downside of a given cycle might take longer than previously expected.
For most semiconductor companies, China is both a consumer and a supplier. China consumes more than 50% of all semiconductors made worldwide. Furthermore, many US technology companies either have manufacturing plants in China or use Chinese companies in their supply chains. Thus, in 2018 and 2019, pressures like the US-China trade war weighed significantly on the sector's outlook.
At present, the current health and economic environments in the US and globally present an array of uncertainty. Meanwhile, we are entering a busy earnings season. As a result, given the recent stellar increase in the prices of many semiconductor stocks, there may likely be short-term volatility and profit-taking in the sector.
However, as new frontiers in technology—such as the internet of things (IoT), artificial intelligence (AI), autonomous driving, and 5G—are developed, we are bullish on the future of the semiconductor industry.
With that in mind, here are two semiconductor ETFs that could be appropriate for long-term portfolios:
1. iShares PHLX Semiconductor ETF
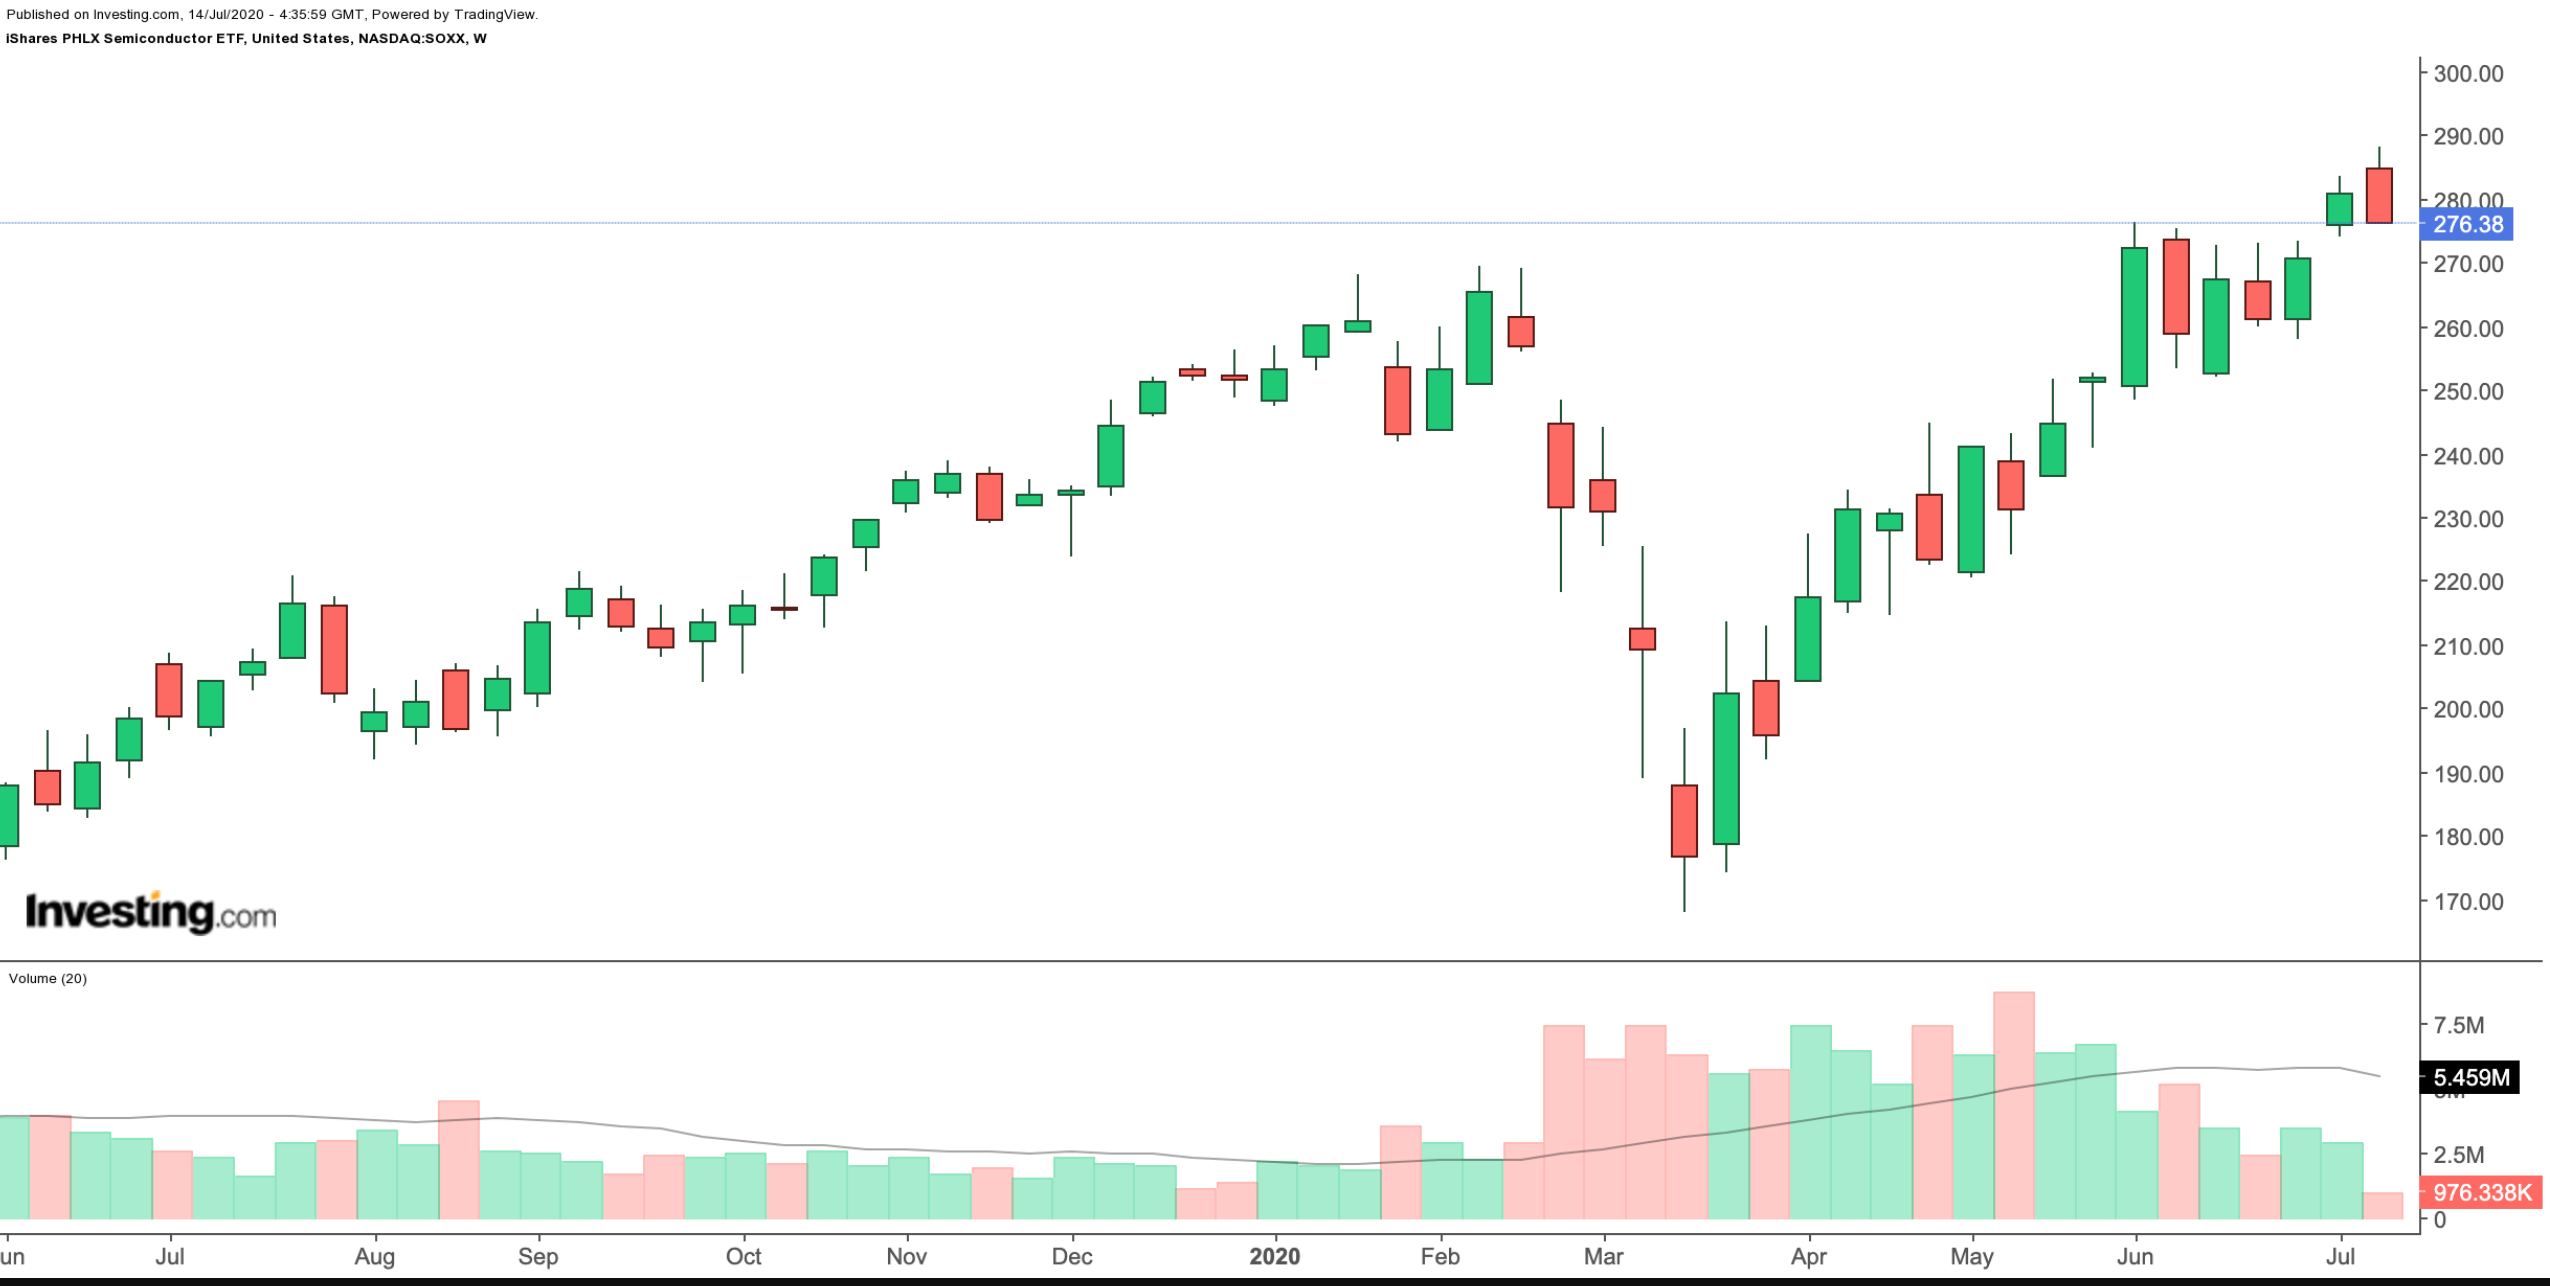
- Current Price: $276.38
- 52-week range: $167.79-$288.05
- Current Dividend Yield: 1.1%
- Expense ratio: 0.46% per year, or $46 on a $10,000 investment
As one of the largest semiconductor ETFs, the iShares PHLX Semiconductor ETF (NASDAQ:SOXX) is a cap-weighted fund, tilting toward the largest semiconductor stocks. Its benchmark index is the SOX.

The ETF currently has 30 holdings. NVIDIA (NASDAQ:NVDA), Qualcomm (NASDAQ:QCOM) and Texas Instruments (NASDAQ:TXN) are its three largest holdings, making up for over 24% of the fund’s roster.
Trailing P/E and P/B ratios stand at 28.18 and 5.75 respectively. Its beta of 1.24 means that SOXX is more volatile than the broader market. Therefore short-term traders may want to exercise caution as prices tend to be choppy.
Many semiconductor stocks will report earnings in the coming weeks. Weaknesses in their fundamental metrics or even a potential warning by one of the large-caps for future quarters could affect the overall ETF. Long-term investors may consider buying the dips.
Investors paying attention to short-term technical charts should be aware that there could be some profit-taking around the corner, which could lead to a likely pull back toward the $260-level or below.
2. SPDR S&P Semiconductor ETF
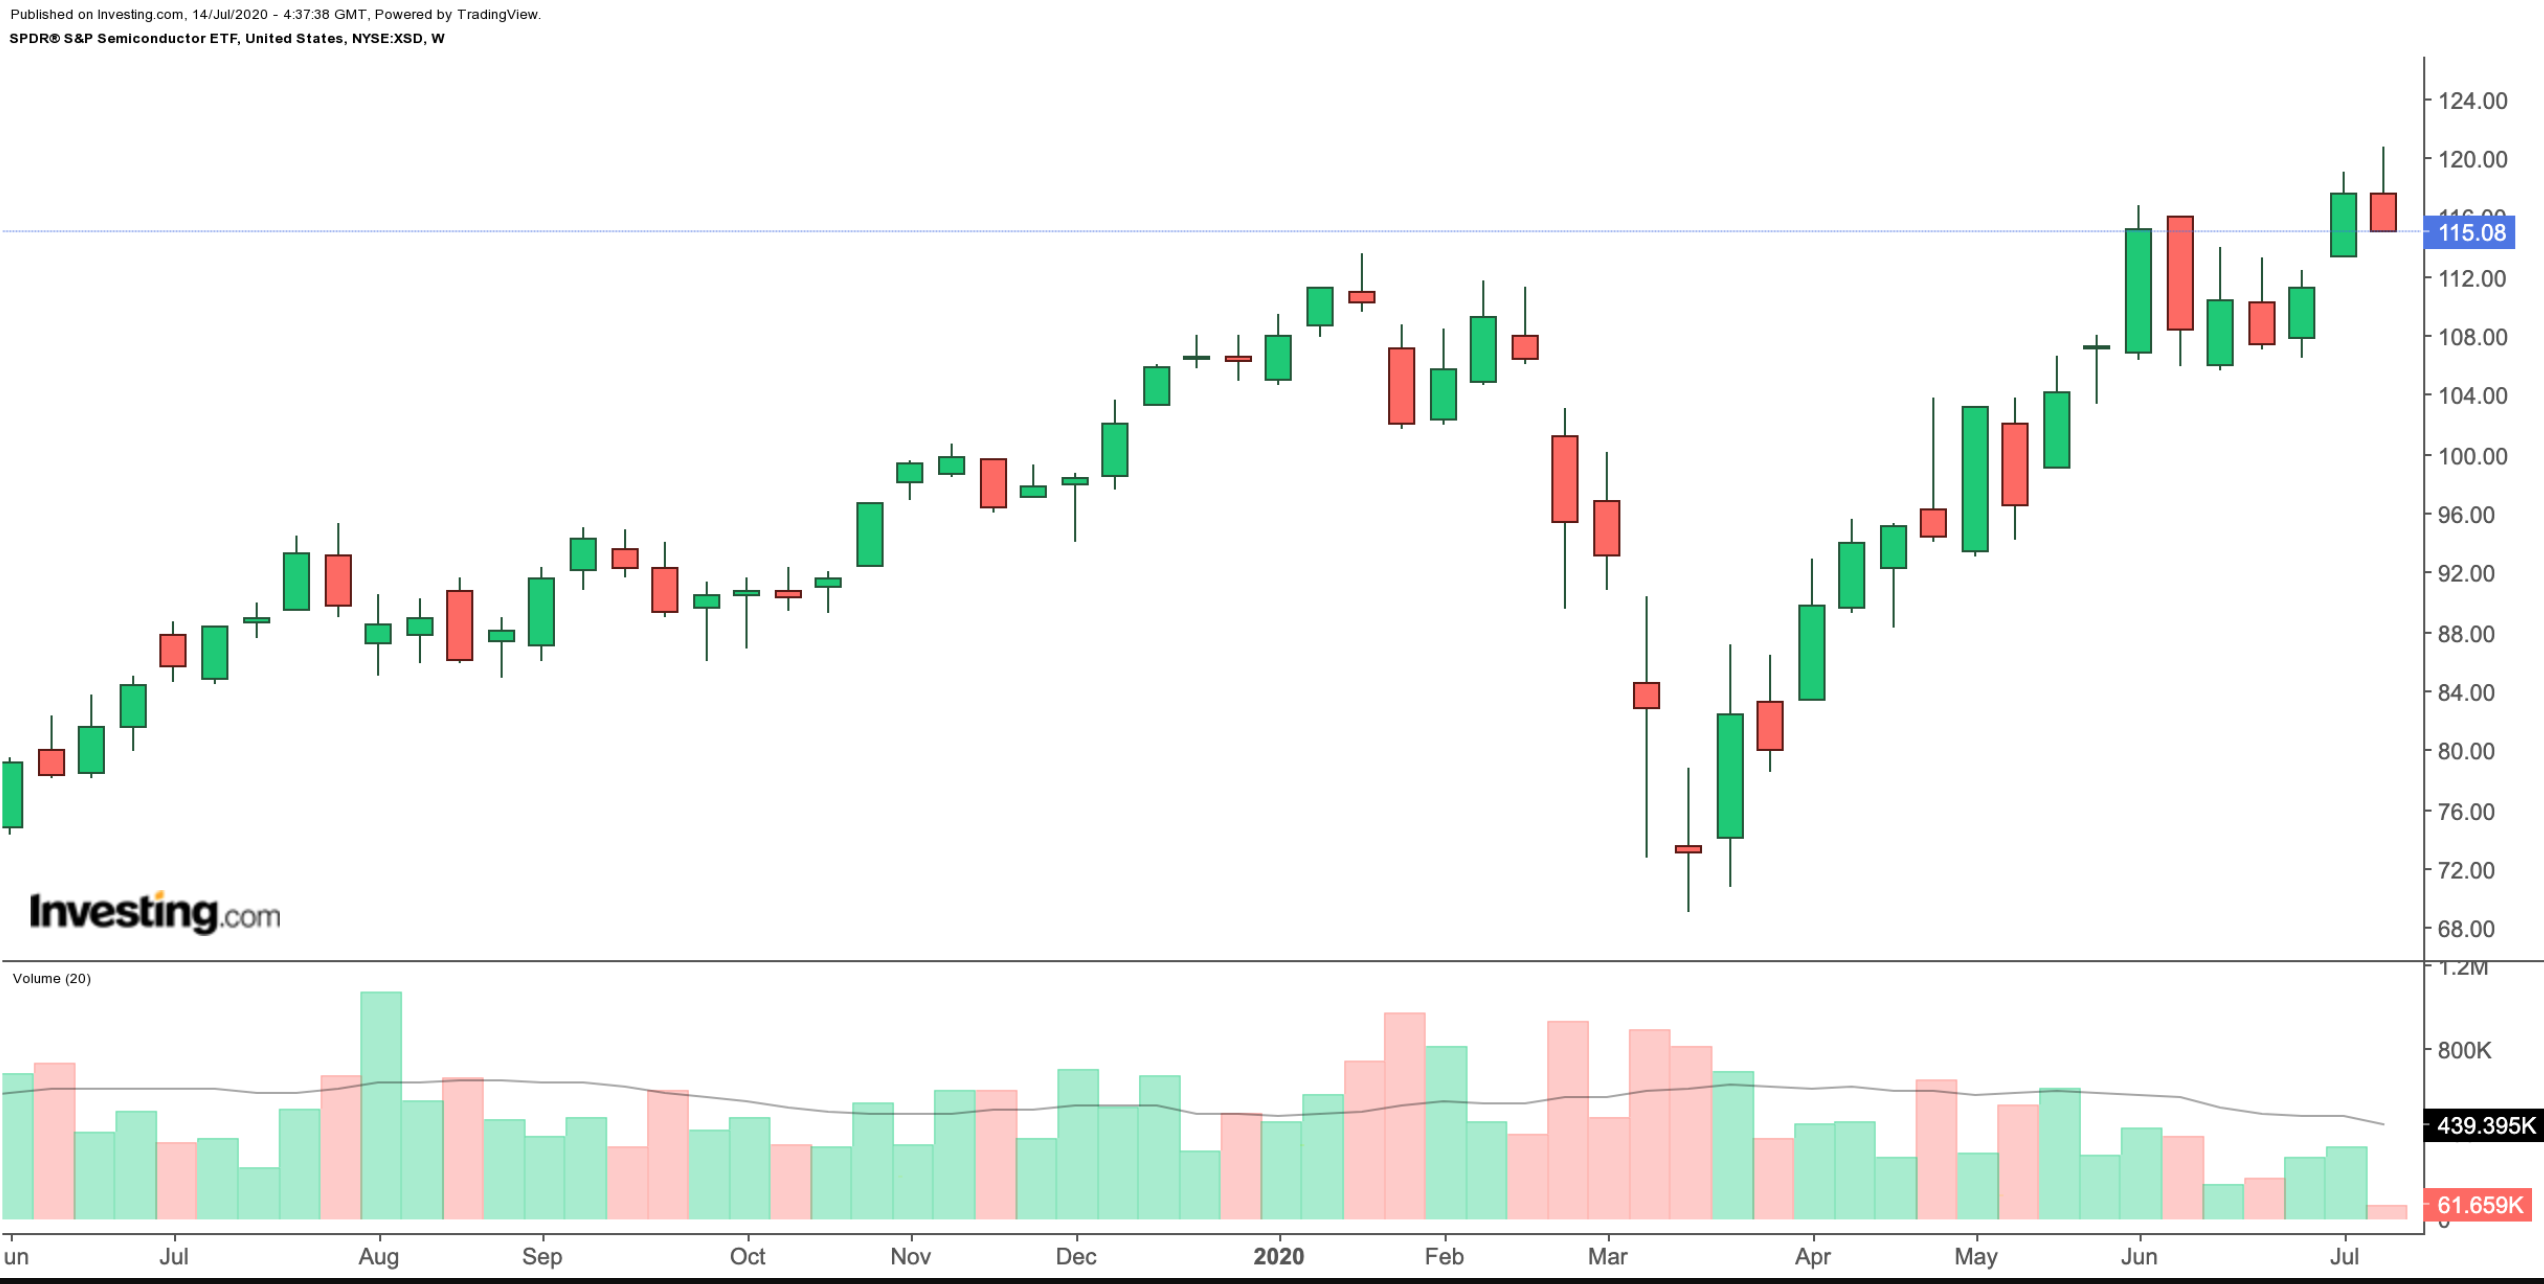
- Current Price: $115.08
- 52-week range: $68.95-$120.95
- Current Dividend Yield: 0.46%
- Expense ratio: 0.35% per year, or $35 on a $10,000 investment
The SPDR® S&P Semiconductor ETF (NYSE:XSD) is an equal-weight fund, making it potentially appropriate for investors looking for exposure to mid- and small-cap semiconductor names. The fund has 36 holdings, the largest of which is SunPower (NASDAQ:SPWR) at just 3.75%. Other stocks held include NVIDIA and Marvell Technology (NASDAQ:MRVL).

Trailing P/E and P/B ratios stand at 28.19 and 4.36 respectively. Its beta of 1.34 means that the XSD is also more volatile than the broader market.
Due to the run-up in price in recent months, a pull back toward the $105-level is likely. Long-term investors may regard such a decline in price as an opportunity to go long the ETF.
