
- 2 Factors That Make SGD/JPY Longs So Attractive
- Percentage-Change Analysis of Key JPY Pairs
- Step-by-Step Parameters for Taking This Trade
The Japanese yen (JPY) has been weak against most key currencies for many months now, and with this trend still active, we’re keen to buy select counterparts against JPY. To select which pair, however, we’re looking for two things:
- A pullback within a favorable Elliott Wave count, and…
- Knowledge that we’re buying a currency that has shown consistentstrength against the Yen.
Using those guidelines, our top choice right now is actually to buy the Singapore Dollar (SGD) versus the Yen, or in other words, go long the SGD/JPY pair.
The hourly chart of SGD/JPY below shows our impulsive Elliott Wave count from the December 18 low of 81.44. It starts with a sharp,130-pip rise to 82.75 (blue wave i). This was followed by a zig-zag correction to 81.95 (blue wave ii). 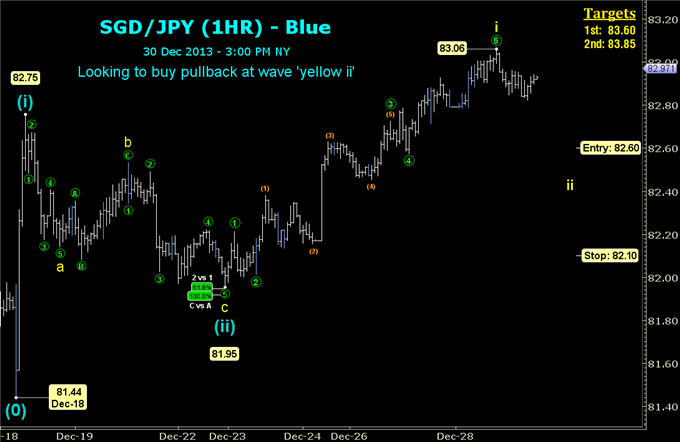 SGD/JPY" title="SGD/JPY" width="670" height="440">
Typical of second waves, the pullback ended at an almost perfect 61.8% Fibonacci retracement of the impulsive rise. Price then rose impulsively in yellow wavei, reaching 83.06 (being one smaller degree). From here, if 83.06 holds, we’ll then see price pull back in yellow wave ii, and we’d expect at least a 50% retracement.
Therefore, we’d look to buy SGD/JPY just above this 50% retracement level, at 82.60. We’re placing a stop just below the 78.6% retracement at 82.10, producing a 50-pip stop. Those who are more conservative may prefer to place their stop at 81.94, which is where the Elliott Wave count is “wrong.”
To make this trade worthwhile from a risk/reward perspective, we’d need to achieve a target at least 50% larger than the size of our stop (i.e. at least 75 pips). Based on the first two blue waves, we could reasonably expect blue wave iii to end above 84.00, being that it is the 161.8% extension of these two blue waves. As the rise has been strong over the past few months, it’s unlikely that this is a corrective move.
We’ll look to set two profit targets, the first of which will be 83.60, 100 pips from the entry point while risking 50 (i.e. risk $1 to make $2). The second take-profit position is 83.85 (125 pips beyond entry), which risks $1 to make $2.50. Both take-profit positions provide very healthy risk/reward ratios and are below the 84.00 level.
Further Validation For Buying SGD/JPY
Most key JPY pairs made significant lows in early October. The below percentage-change chart shows the increase in the key JPY pairs since that time, and this chart goes a long ways toward validating this long SGD/JPY trade idea. 
For example, we may have a favorable Elliott Wave count in AUD/JPY, but this chart would warn against buying that pair because it has had the least percentage increase of the key JPY pairs since early October (just 2% relative to the other key currencies).
Meanwhile, SGD/JPY appears in the middle of this list with a healthy rise of about 7% (compared to the strongest JPY pair, GBP/JPY, which returned 12% during this time).
Potential Long-Entry Opportunity in SGD/JPY
- Trade: Buy SGDJPY at 82.60
- Stop Loss: Place stop at 82.10
- Take Profit: Take half profits at 83.60, and let the remainder of the trade run to 83.85
- Trade Management: Move stop to 82.60 if price reaches 83.60