With bitcoin chopping back and forth, it can certainly be easy to lose interest in cryptocurrency altogether. After all, numerous media outlets now report that investors have recovered from “Bitcoin fever”, and based on the recent lack of volatility, I don’t blame them for growing cold on digital currencies.
But with bitcoin approaching what I’ve identified as a critical moment, you might want to get that thermometer back out – because things could start heating up once again, very quickly.
Bitcoin, which currently enjoys a staggering 53% market dominance, leads the way for the rest of the market. Wherever Bitcoin goes, altcoins tend to follow.
Yes, there are exceptions to the rule, but these are typically just short-term “bursts” that occur, before settling down back into the long-term norm that crypto investors have grown accustomed to.
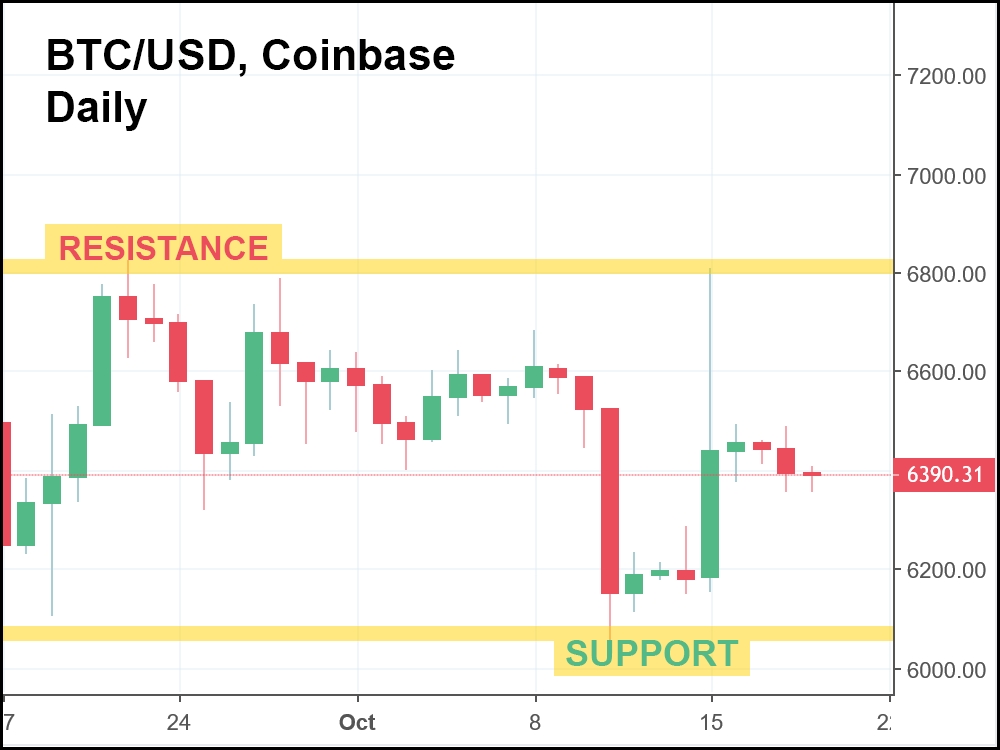
And right now, Bitcoin’s price is stuck – trading between $6,000 (support) and $6,800 (resistance):
When bitcoin eventually breaks out of this price range (and it will), it’s going to take the rest of the market with it, because of that overwhelming market dominance we just talked about.
To no surprise, this has many investors concerned, because if bitcoin does drop below that support level at $6,000, the last line of defense would be $5,700 (which is not too far off).
However, because bitcoin has already survived multiple sell-offs this year down to key support, a drop below $5,700 seems highly unlikely. Moreover, every time Bitcoin has fallen to key support, it came back with a small rally, without fail.
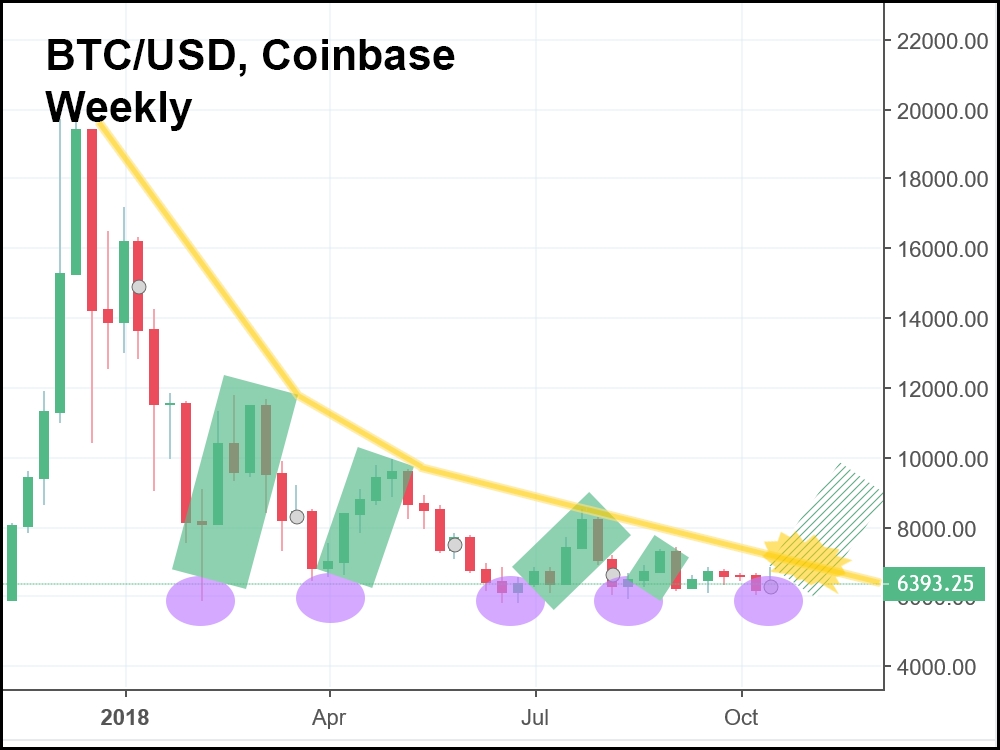
In the weekly candlestick chart above, you can see how bitcoin rallied (green rectangle) each time after hitting support (purple oval). The most recent clash with support came just last week, and if Bitcoin can escape that $6,800 resistance level on the daily chart, it could also be the start of the next rally that propels BTC into a trend reversal.
The yellow line in the chart tracks the weekly candlestick highs, which have been descending since bitcoin hit nearly $20k in 2017. If the next rally is big enough (which seems likely, as the market continues to chop sideways), it could get enough momentum to finally break out of the doldrums – starting an upwards move in a major way, dragging the rest of the market kicking and screaming.
And in the chance that Bitcoin heads the opposite direction, blowing past the $6,000 support level en route to $5,700, I haven’t seen any price action over the last year that suggests an even bigger drop from there. What seems more likely, in my opinion, is an even stronger rally back up.
So, with volatility settling down, frustrated investors may finally get what they’ve been waiting for – a true breakout scenario, fueled by bitcoin’s “never say die” resilience that continues to inspire digital currency holders across the globe.


