It's a busy week for Cleveland-Cliffs Inc (NYSE:CLF), with the mining firm hosting its annual shareholders meeting today, and reporting first-quarter earnings before the market opens tomorrow, April 25. At last check, CLF stock was trading up 0.6% at $9.55, but could be in for a bigger move tomorrow, if history is any guide.
Trade-Alert pegs CLF's implied earnings deviation at 13.1%, much wider than the 6.9% next-day move the stock has averaged over the past two years. The closest any of the last eight earnings reactions have been to tomorrow's projected move was a 12.7% single-session gain last July, while last quarter, the equity jumped 8.5% the day after earnings.
Another post-earnings move to the upside could shake some of the weaker bearish hands loose. Short interest on CLF stock rose 11.7% in the two most recent reporting periods to 58.66 million shares. This accounts for one-fifth of the security's available float, or 6.2 times the average daily pace of trading.
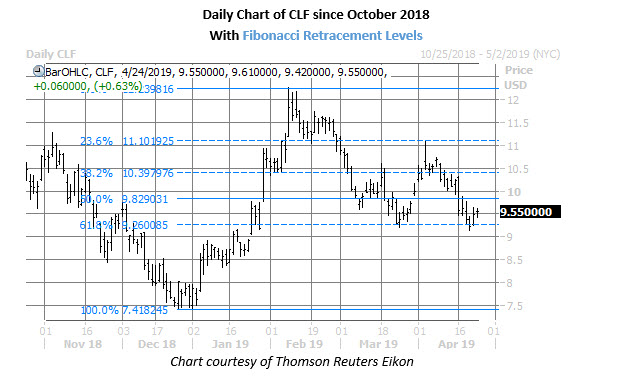
On the charts, Cleveland-Cliffs has had a tough month, down 13.6% since its April 3 peak at $11.07. However, the shares appear to have found a familiar floor near $9.20 -- a region that served as support in late March, and is home to a 61.8% Fibonacci retracement of CLF's rally from its Dec. 26 low at $7.40 to its Feb. 8 high at $12.26.

Arizona-based mining company Freeport-McMoran Copper & Gold Inc (NYSE:FCX) will report its first-quarter results ahead of tomorrow's open, as well. The consensus per-share estimate is 7 cents, according to Refinitiv, and the firm has beat per-share profit forecasts in two of the past four quarters.
FCX stock, however, has closed lower in the session subsequent to earnings in each of the past four quarters, averaging a loss of 9.2%. This time around, the options market is pricing in an 8.9% next-day move, regardless of direction.
Options traders appear to be positioning for a post-earnings move to the upside, though. At the International Securities Exchange (ISE), Chicago Board Options Exchange (CBOE), and NASDAQ OMX PHLX (PHLX), FCX's 10-day call/put volume ratio of 9.27 ranks in the 91st annual percentile, meaning calls have been bought to open over puts at an accelerated clip. The June 16 call, specifically, has seen the biggest increase in open interest over this two-week time frame.
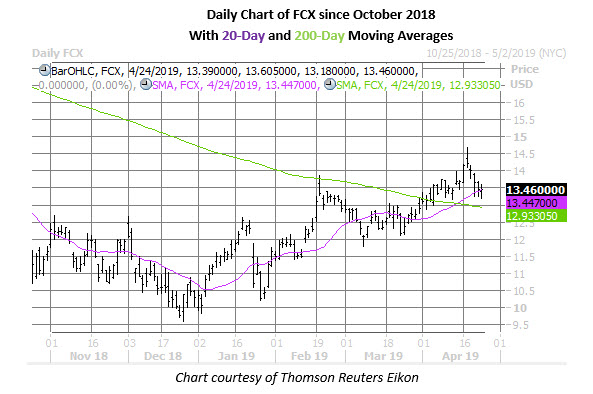
At last check, FCX shares were flat at $13.46. The stock has added 40% since its late-December trek into single-digit territory, bouncing along a trendline connecting higher lows. More recently, the equity broke out above its 200-day moving average earlier this month, and a pullback from its April 17 seven-month high of $14.67 was contained by Freeport-McMoRan's 20-day trendline.

