
When I talk to investors about closed-end funds (CEFs), I get an almost universal reaction: they simply can’t believe the outsized dividends—and upside potential—these funds boast are for real.
I’ll admit, if you’re not familiar with CEFs, their many benefits do sound a bit over the top: a pocket of funds that yield 7.5% on average, yet hold investments we’re all familiar with, such as shares of Alphabet (NASDAQ:GOOGL) and Mastercard (NYSE:MA)?
The outsized payouts seem particularly unreal when you consider that most of these blue chips pay low (or no) dividends themselves. And that’s before we get into the fact that CEFs can hold a range of other investments beyond stocks, like corporate bonds, real estate investment trusts (REITs) and municipal bonds.
Moreover, whether they hold stocks or not, many CEFs—which are actively managed—beat their benchmarks on the regular, putting the old debate over passive-versus-active investing to bed once and for all.
Picking Winning CEF Is All About the Dividends and the Discounts
The truth is, there are two important ways CEFs deliver strong returns: their outsized dividends (which we’ll “demystify” now) and their discounts to net asset value (NAV, or the value of their portfolios), which we’ll delve into in a second.
The best CEFs deliver their big dividends in a pretty straightforward way: management simply sells its winners, combines the profits with the dividends it receives from its portfolio and hands the total to us as dividends.
In addition, some CEFs use leverage to boost returns further. That’s a good tool for management to use (in a reasonable way, of course!), as they can borrow at lower rates than you and I can. The best way to see this in action—and to see exactly how CEF investing can produce lasting wealth—is to look at an example. Let’s do that now.
An “All-Star” CEF That Crushes ETFs
The Liberty All Star Equity Closed Fund (NYSE:USA) is a CEF that gets my attention regularly because of its strong portfolio and track record. With a large-cap US stock focus, USA is a good replacement for a popular S&P 500 index fund like the SPDR® S&P 500® ETF Trust (ASX:SPY), especially since USA (in orange below) has beaten SPY for a long time.
USA Outruns the Market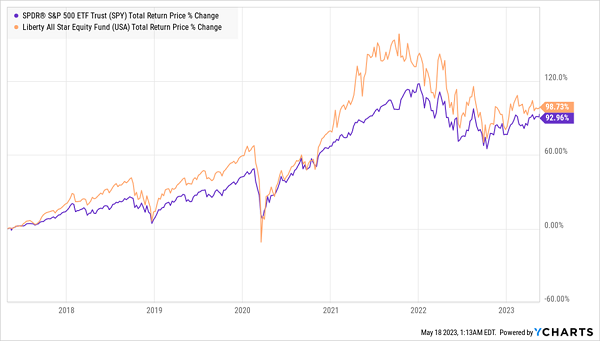
Since May 1, 2017, USA, which uses no leverage, has outperformed the S&P 500 while giving investors a 98.7% total return (or 11.4% annually). That’s ahead of the broader stock market (the purple line above). I’m not pulling that date out of thin air: it’s the first time I wrote about USA for Contrarian Outlook. Back then, I wrote that the fund is “certainly a better option than passive index investing.” The chart above proves this point.
Investors who put their money in USA back then have earned $9,873 for every $10,000 invested, while getting $80 per month for each $10,000 invested as dividends. Plus, USA’s payout, which yielded 9.5% when I first recommended it has grown since then.
USA’s Rising Income Stream

Before we go further, as you can see above, USA’s dividend doesn’t march upward in a straight line. That’s because management’s policy is to pay out 10% of the fund’s net asset value (NAV, or the per-share value of its portfolio) as dividends per year, so the payout tends to float along with NAV.
Which brings me to another critical aspect of picking CEFs: you need to make sure you’re looking at the right chart to get a clear picture of past performance. And popular screeners, like Yahoo! Finance and Google Finance, just don’t cut it here.
The Orange Line—Not the Purple—Tells the Real Story of CEF Profits
If you look up USA, or any CEF for that matter, on these screeners, you’ll see the fund’s market-price return by default. That’s the purple line above, which shows a measly 8.7% gain over a six-year period!
But let’s back up for a second. See the orange line? That includes dividends. And USA has paid out about a 10% yield throughout this time period, while delivering an 11.4% annualized total return. In other words, almost all of USA’s profits have been given to investors in the form of cash dividends. And those dividends don’t show up on a stock-price chart.
To see the profits with dividends included, you need to look at the total-return price—a function that’s not available on any free finance website that I’m aware of. But it’s an important number: if we look at USA’s total profits in both dividends and capital gains, we see that the CEF nearly doubled an investment made back in May 2017, in addition to beating the broader market.
(Note that I have this data at my fingertips when making recommendations for my CEF Insider service, so you always know that my recommendations are based on a complete picture of a fund’s past performance.)
About Those CEF Discounts
Now let’s talk discounts, which are critical because CEFs can—and often do—trade at a different level than their portfolio value (these discounts only exist with CEFs, which generally can’t issue new shares to new investors).
USA’s Closing Discount Boosts Its Market Price
That was another factor in USA’s gain in the past six years: as you can see above, back in May 2017, the fund traded at a roughly 14% discount that’s since narrowed to around 1%. As that discount closed, it supported the share price, allowing investors to collect their double-digit dividends from USA without giving any of that cash back in the form of share-price declines.
Disclosure: Brett Owens and Michael Foster are contrarian income investors who look for undervalued stocks/funds across the U.S. markets. Click here to learn how to profit from their strategies in the latest report, "7 Great Dividend Growth Stocks for a Secure Retirement."