Long-term equity portfolios typically diversify across sectors and regions, as well as market capitalization (cap). Understanding the characteristics of these categories is important as they have different risk/return profiles and could behave differently depending on market conditions.
We previously discussed an exchange traded fund (ETF) that tracks small-cap stocks. Today, we'll focus on mid-caps and take a closer look at two funds.
The Case For Mid-Caps
In the US, mid-cap stocks are typically considered to be those firms with a market cap between $2 billion and $10 billion. However, differences in definition may exist among brokers. Similarly, some ETFs that describe themselves as “mid-cap” could include companies whose market-cap is larger than $10 billion. Historically, ceilings for each cap category have gone up.
Market value affects expectations about a company’s future. Mid-cap stocks have grown large enough to graduate from the small-cap realm. Thus their operations are more established and possibly less risky. However, if the economic contraction continues longer than expected, mid-caps may have a harder time weathering the storm than large-caps.
Nonetheless, they are still small and possibly flexible enough to continue growing into a larger cap business. For instance, a company with a market valuation of $7 billion is likely to double in value more quickly than a company with a market cap of $70 billion.
The “mergers and acquisitions” (M&A) theme tends to be significant for mid-cap companies. Management could decide to buy a smaller company or merge with a comparable or even larger business. Such an approach might become both a blessing and a curse for a mid-cap company and its investors. Significantly, large-caps tend to acquire mid-caps, a move that usually creates value for shareholders.
Academic research and most financial planners tend to agree, a diversified portfolio that includes companies with various market caps could help reduce risk and volatility. As such, investment returns are likely to be higher over the long haul.
Mid-cap companies in general do not have as much analyst coverage as large businesses. This leaves room for quite a number of them to stay below the radar. Investors willing to put time into research are likely to find mid-cap firms with a promising future.
Alternatively, they may do due diligence on a range of funds that specialize in mid-cap stocks. Here are two that may be of interest:
1. SPDR S&P MIDCAP 400 ETF
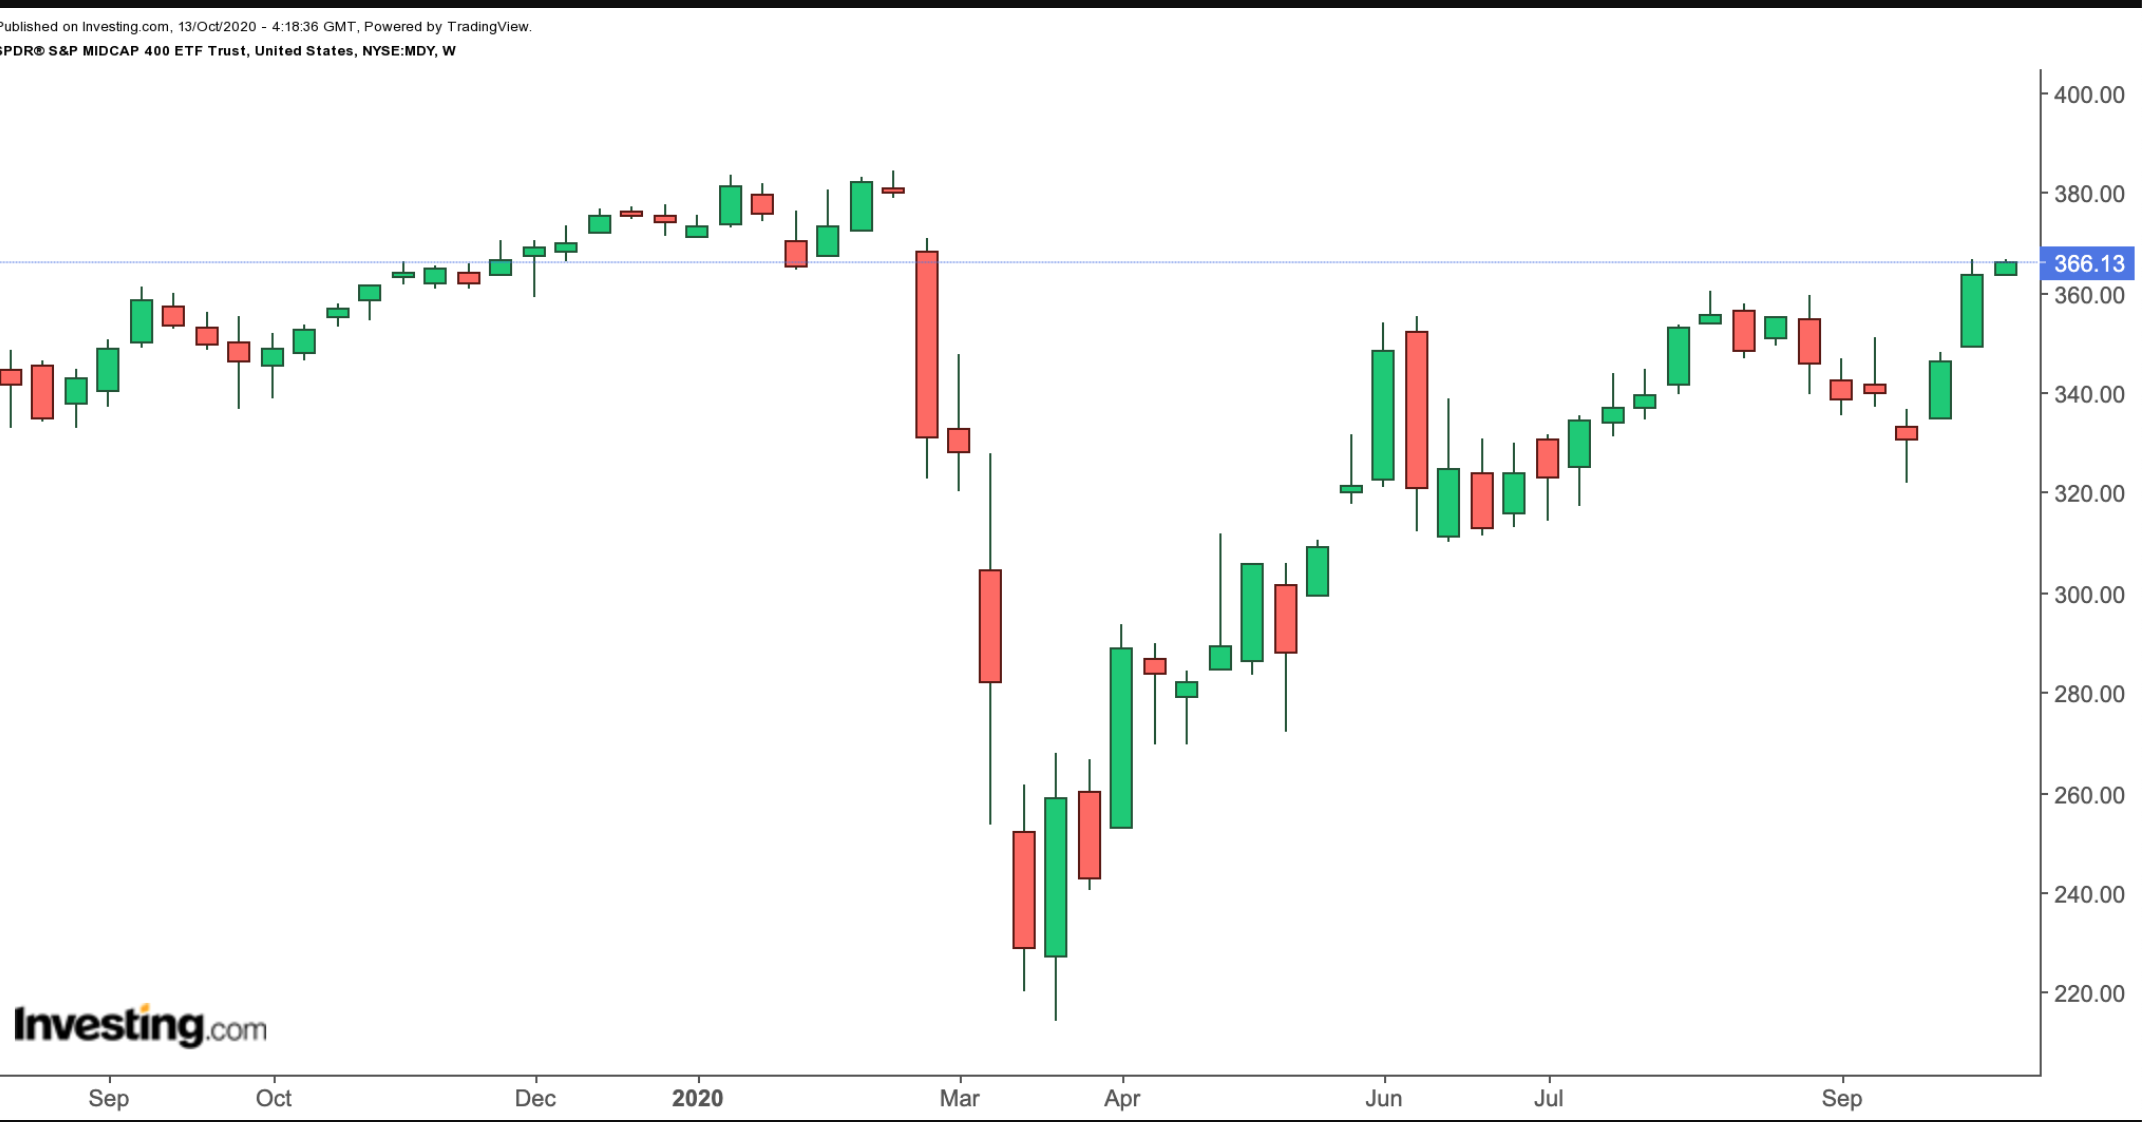
- Current Price: $$366.13
- 52 Week Range: $214.22-$384.47
- Dividend Yield: 1.67%
- Expense Ratio: 0.23%
The SPDR S&P MIDCAP 400 ETF (NYSE:MDY) provides exposure to 400 mid-cap companies.

MDY tracks the S&P Midcap 400® Index. The top ten holdings constitute around 7% of net assets, which stand at around $15.5 billion. No single company has more than 0.8% weighting. Put another way, company-specific risks have mostly been diversified away.
Heading the list of current holdings: SolarEdge Technologies (NASDAQ:SEDG), Enphase Energy (NASDAQ:ENPH), Monolithic Power Systems (NASDAQ:MPWR), Generac Holdlings (NYSE:GNRC) and Trimble (NASDAQ:TRMB).
In terms of sector allocation, Industrial companies (17.89%) top the list, followed by Information Technology (16.07%), Consumer Discretionary (14.92%), Financials (14.03%), Health Care (11.36%), Real Estate (9.35%), Materials (5.89%), Consumer Staples (3.93%), Utilities (3.73%), Communication Services (1.68%), and Energy (1.16%).
Since the start of the year, the fund is down about 3%. In comparison, the SPDR S&P 500 ETF (NYSE:SPY), which tracks the S&P 500 index is up close to 8%. Put another way, S&P mid-caps have been lagging broader S&P 500 companies. MDY’s trailing P/E and P/B ratios are 21.42 and 1.87, respectively. Investors who expect mid-caps to ultimately catch-up with large-cap shares may consider buying the dips.
2. Vanguard Mid-Cap ETF
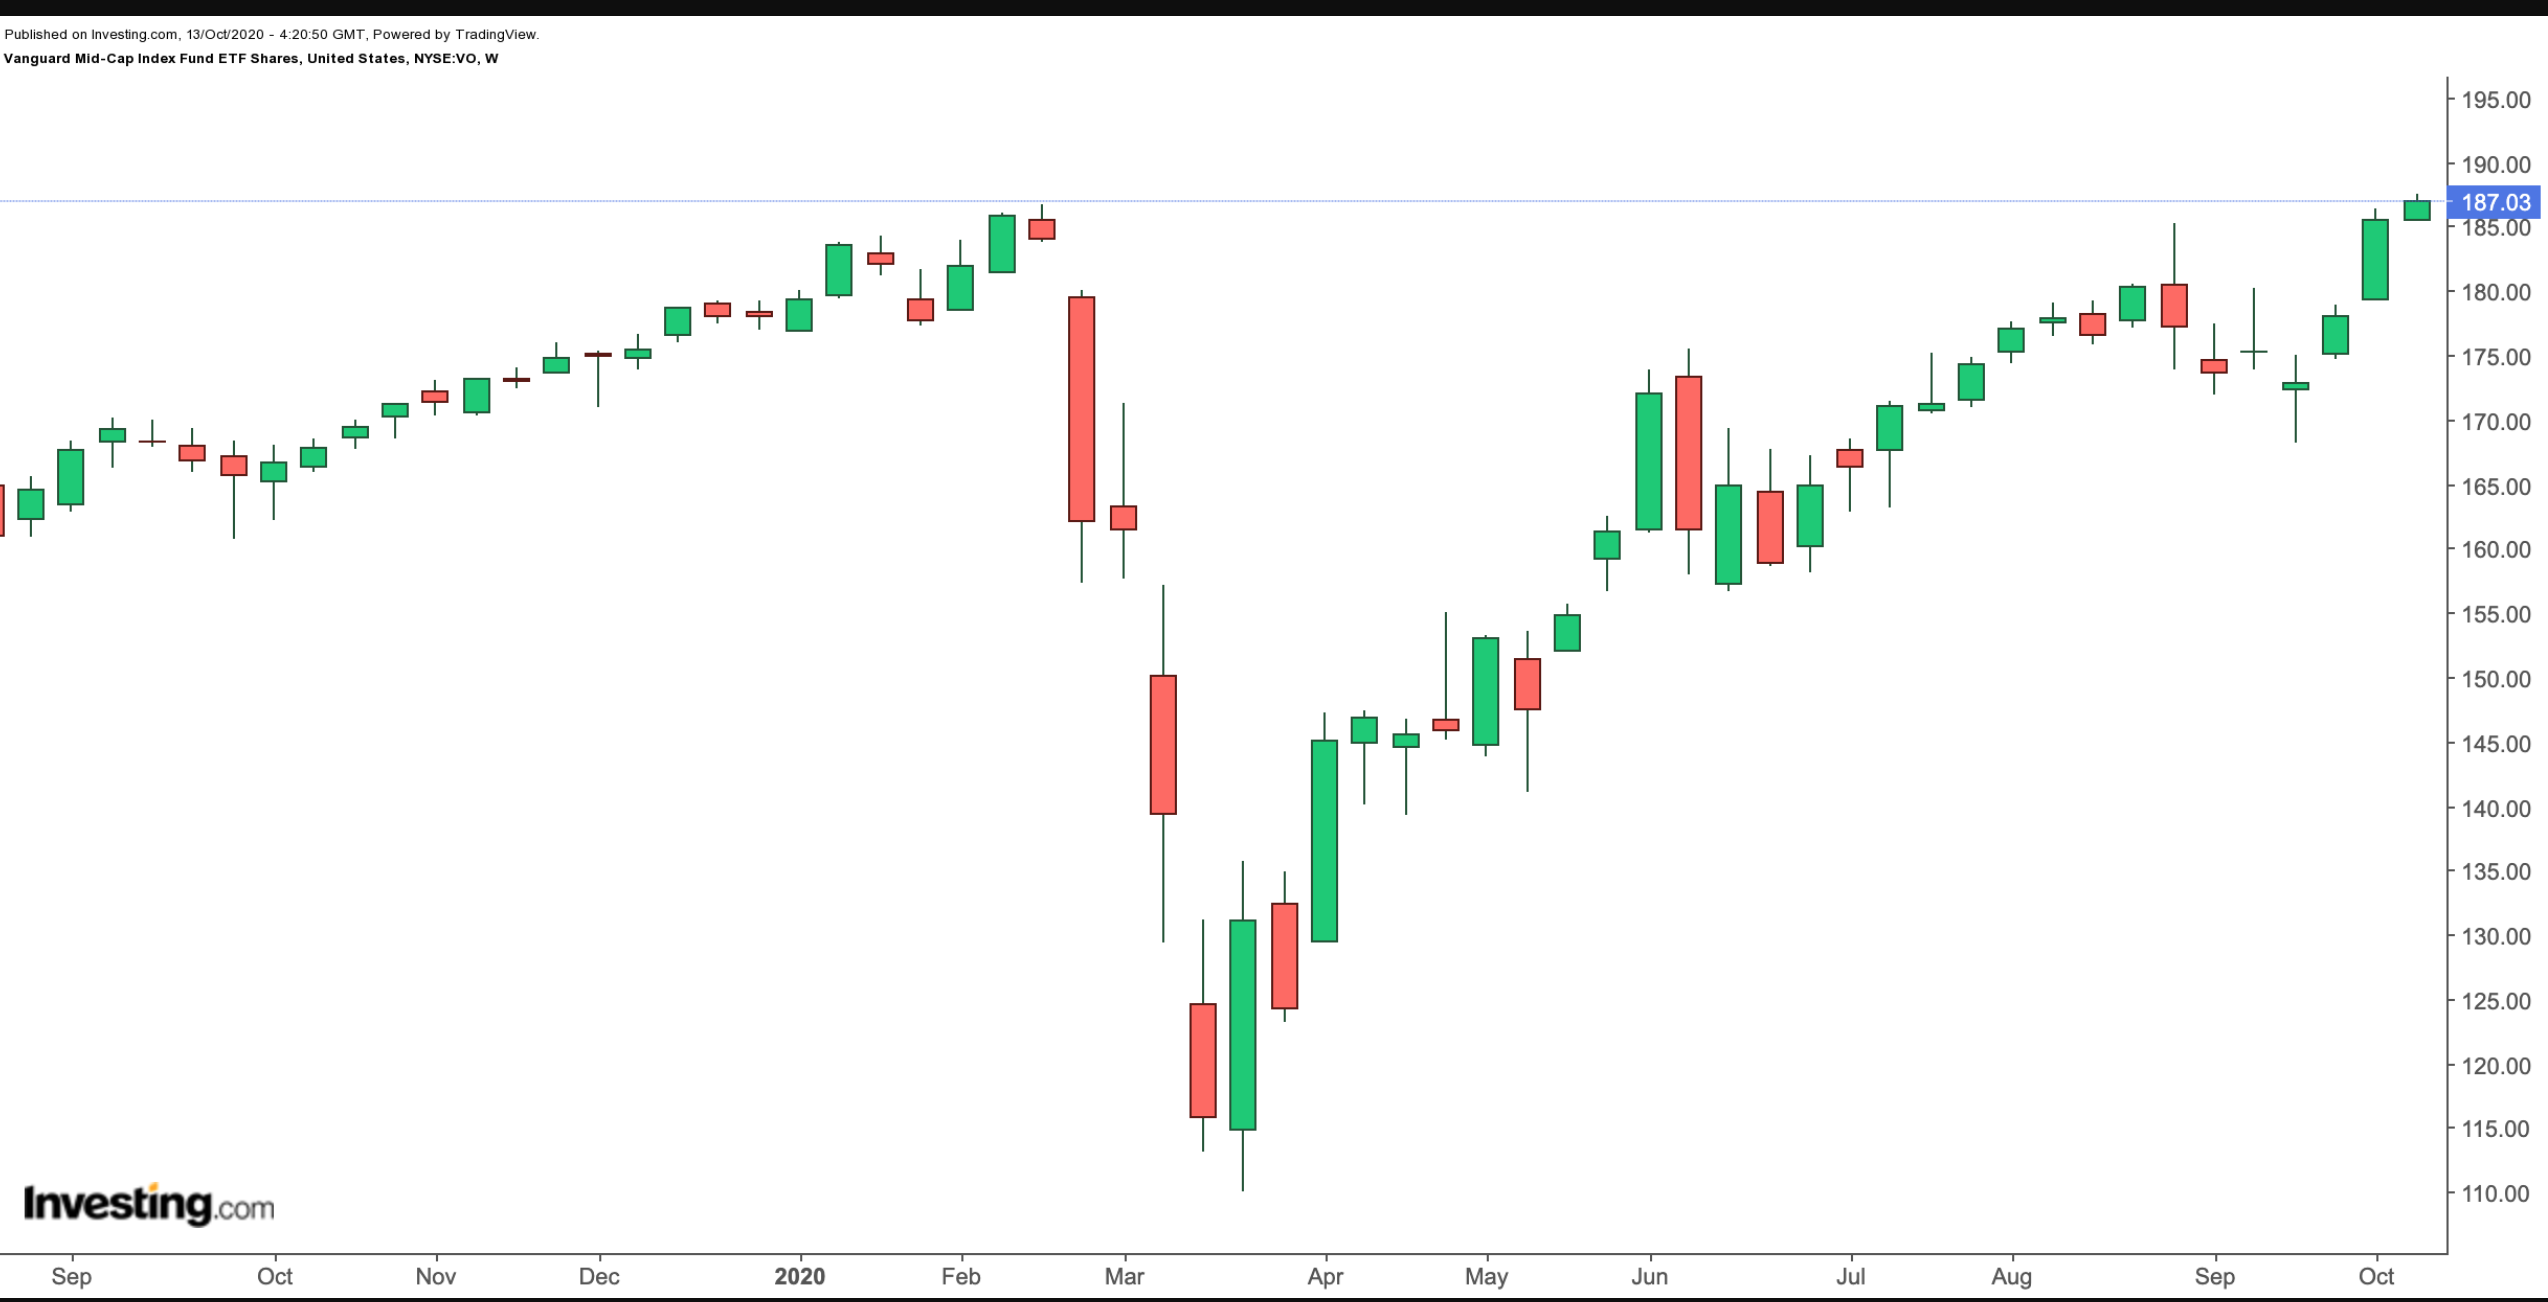
- Current Price: $187.03
- 52 Week Range: $110.05 - $187.54
- Dividend Yield: 1.63%
- Expense Ratio: 0.04%
The Vanguard Mid-Cap Index Fund ETF (NYSE:VO) also provides exposure to a range of mid-cap U.S.-based firms.

VO, which has 360 holdings, tracks the CRSP US Mid Cap Index. The top ten holdings make up close to 8% of net assets, which stand at $116 billion.
Lululemon Athletica (NASDAQ:LULU), Digital Realty Trust (NYSE:DLR), DexCom (NASDAQ:DXCM), DocuSign (NASDAQ:DOCU), and Veeva Systems (NYSE:VEEV) top the fund. Investors may notice that each of these companies have capitalizations well over $10 billion.
The top sector allocation (by weighting) is Technology (21.10%). Next in line are Financials (20.30%), Industrials (15.70%), Consumer Services (11.50%), Health Care (9.70%), and are Consumer Goods (9.60%).
Year-to-date, the fund is up about 5% and hit an all-time high on Oct. 12. Valuation—as would be indicated by the trailing P/E (25.9) and P/B (2.9) ratios—remains elevated. The current earnings season may bring short-term profit-taking in a large number of stocks, which could put pressure on the fund.
A drop toward $175 would improve the margin of safety for long-term portfolios.
