Breaking News
Investing Pro 0
Cyber Monday Deal: Up to 55% off CLAIM SALE

2 Bank Stocks That May Rebound Sharply Short-Term

By Michael KramerStock MarketsMar 29, 2019 02:00AM ET
www.investing.com/analysis/2-bank-stocks-poised-to-rebound-sharply-shortterm-200401918
2 Bank Stocks That May Rebound Sharply Short-Term
By Michael Kramer   |  Mar 29, 2019 02:00AM ET
Saved. See Saved Items.
This article has already been saved in your Saved Items
 
 
US500
+0.10%
Add to/Remove from Watchlist
Add to Watchlist
Add Position

Position added successfully to:

Please name your holdings portfolio
 
C
-0.48%
Add to/Remove from Watchlist
Add to Watchlist
Add Position

Position added successfully to:

Please name your holdings portfolio
 
BAC
-0.08%
Add to/Remove from Watchlist
Add to Watchlist
Add Position

Position added successfully to:

Please name your holdings portfolio
 
US10Y...
-0.87%
Add to/Remove from Watchlist
Add to Watchlist
Add Position

Position added successfully to:

Please name your holdings portfolio
 

This post was written exclusively for Investing.com

Shares of Bank of America Corp. (NYSE:BAC) and Citigroup Inc. (NYSE:C) were pummeled after the Fed turned dovish, but they may be poised to bounce back sharply, according to the options market and technical charts.

Both lenders’ shares could climb as much as 8% over the next few weeks after plunging following the Fed’s pivot on monetary policy, as investors fretted about how lower interest rates may affect the banks’ profitability.

Since March 18, the shares of Bank of America and Citigroup have fallen by as much as 9% versus an S&P 500 which has dropped by less than 1%. That may be about to change.

Bulls Return to Citi

Citigroup’s stock has seen bullish betting in its options in recent days. Open interest levels of the calls for expiration on April 18 at the $64.50 strike price have jumped by over 20,000 contracts, a bet the stock will rise. As of March 27, those calls have a premium of about $0.45 per contract, and for a buyer of the calls to earn a profit the stock would need to rise to roughly $65 by the expiration date.

The technical chart for Citigroup supports the bullish outlook the options suggest. The stock has managed to hold a critical region of technical support around $60 to $61 recently. This support level has been in place since the beginning of 2019, with the stock rebounding each time. Should this level continue to hold the stock is likely to rebound to a long-term downtrend at roughly $65, a gain of about 7%.
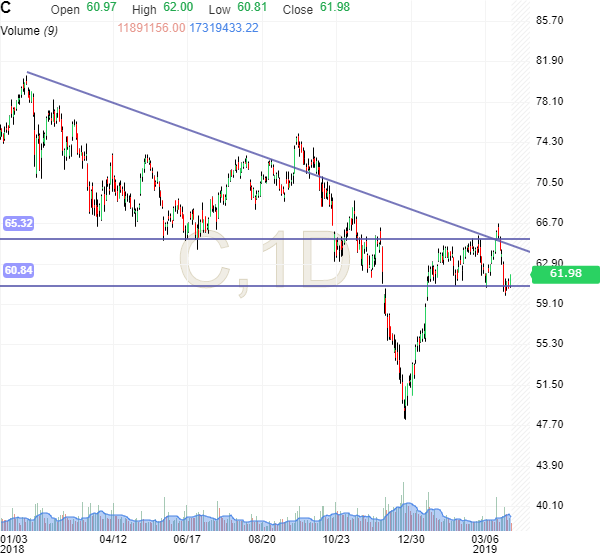
Citigroup
Citigroup

Positive Views on Bank of America

A similar thing is happening with Bank of America stock; it’s also seen bullish betting in recent days at the $29 calls for expiration on May 17. The number of call contracts has increased by roughly 35,000 bringing the total number of open contracts to around 75,000. For a buyer of the calls to earn a profit, the stock would need to rise to approximately $29.40, a gain of about 8% from its price of $27.10 on March 27.

The technical chart suggests the shares rise agreeing with the options bets. The stock had filled a technical gap created when the shares jumped higher on Jan. 16 which is now acting as a level of support at roughly $26.80. Additionally, the stock found further support at a downtrend that has been in place since mid-August. Should support hold at both levels, the shares could rise to resistance around $28.
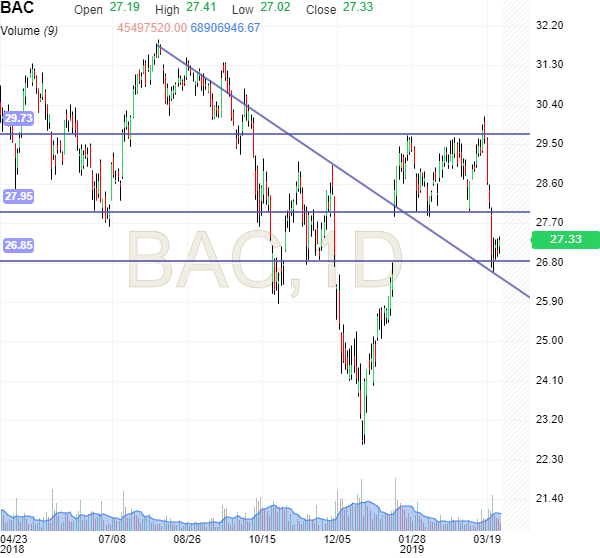
Bank of America
Bank of America

Estimates Could Fall Further

One reason why investors have grown so bearish on the banks is that the Federal Reserve has signaled it sees no more rate hikes in 2019, while also trimming their growth outlook for the U.S. economy. This resulted in yields on the 10-year Treasurys falling by roughly 25 basis points and may negatively impact the banks’ net-interest income --pressuring profits. Additionally, a slower-growing economy could hurt the two lenders’ ability to grow loans, also hurting revenue and earnings growth.

Since the beginning of February consensus analyst earnings estimates have fallen by over 1% and are trending lower for the companies. The events of the past week could result in those estimates falling even further. Both banks have done a relatively good job in the past managing investors’ earnings expectations, even topping those estimates on multiple occasions. Both are expected to report results in the middle of April.
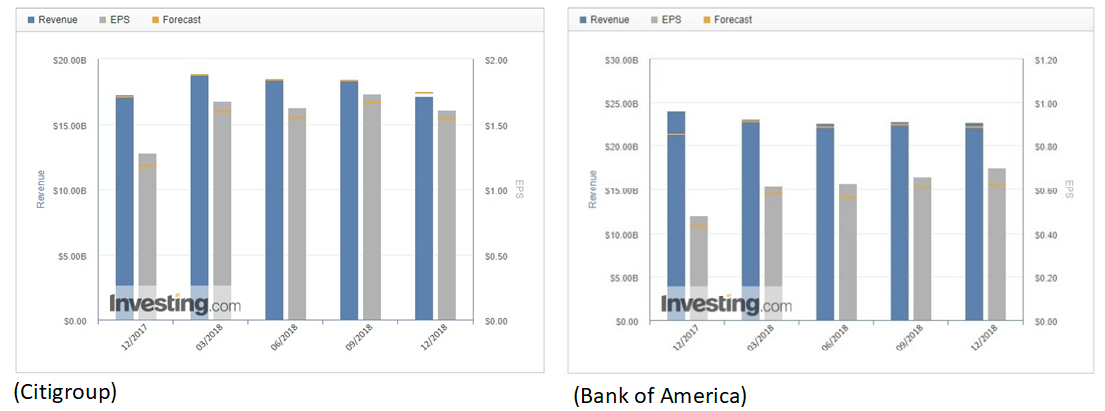
BoA/Citigroup Estimates

There is always the risk that the two stocks fall below the support levels noted above due to the increasing volatility in the broader market, resulting in an even steeper decline. But for now, the momentum and the bets seem to suggest a rebound may be in the works, at least over the short-term.

Disclaimer: Mott Capital Management, LLC is a registered investment adviser. Information presented is for educational purposes only and does not intend to make an offer or solicitation for the sale or purchase of any specific securities, investments, or investment strategies. Investments involve risk and unless otherwise stated, are not guaranteed. Be sure to first consult with a qualified financial adviser and/or tax professional before implementing any strategy discussed herein. Upon request, the advisor will provide a list of all recommendations made during the past twelve months. Past performance is not indicative of future performance.

2 Bank Stocks That May Rebound Sharply Short-Term
 

Related Articles

2 Bank Stocks That May Rebound Sharply Short-Term

Add a Comment

Comment Guidelines

We encourage you to use comments to engage with other users, share your perspective and ask questions of authors and each other. However, in order to maintain the high level of discourse we’ve all come to value and expect, please keep the following criteria in mind:  

  •            Enrich the conversation, don’t trash it.

  •           Stay focused and on track. Only post material that’s relevant to the topic being discussed. 

  •           Be respectful. Even negative opinions can be framed positively and diplomatically. Avoid profanity, slander or personal attacks directed at an author or another user. Racism, sexism and other forms of discrimination will not be tolerated.

  • Use standard writing style. Include punctuation and upper and lower cases. Comments that are written in all caps and contain excessive use of symbols will be removed.
  • NOTE: Spam and/or promotional messages and comments containing links will be removed. Phone numbers, email addresses, links to personal or business websites, Skype/Telegram/WhatsApp etc. addresses (including links to groups) will also be removed; self-promotional material or business-related solicitations or PR (ie, contact me for signals/advice etc.), and/or any other comment that contains personal contact specifcs or advertising will be removed as well. In addition, any of the above-mentioned violations may result in suspension of your account.
  • Doxxing. We do not allow any sharing of private or personal contact or other information about any individual or organization. This will result in immediate suspension of the commentor and his or her account.
  • Don’t monopolize the conversation. We appreciate passion and conviction, but we also strongly believe in giving everyone a chance to air their point of view. Therefore, in addition to civil interaction, we expect commenters to offer their opinions succinctly and thoughtfully, but not so repeatedly that others are annoyed or offended. If we receive complaints about individuals who take over a thread or forum, we reserve the right to ban them from the site, without recourse.
  • Only English comments will be allowed.
  • Any comment you publish, together with your investing.com profile, will be public on investing.com and may be indexed and available through third party search engines, such as Google.

Perpetrators of spam or abuse will be deleted from the site and prohibited from future registration at Investing.com’s discretion.

Write your thoughts here
 
Are you sure you want to delete this chart?
 
Post
Post also to:
 
Replace the attached chart with a new chart ?
1000
Your ability to comment is currently suspended due to negative user reports. Your status will be reviewed by our moderators.
Please wait a minute before you try to comment again.
Thanks for your comment. Please note that all comments are pending until approved by our moderators. It may therefore take some time before it appears on our website.
 
Are you sure you want to delete this chart?
 
Post
 
Replace the attached chart with a new chart ?
1000
Your ability to comment is currently suspended due to negative user reports. Your status will be reviewed by our moderators.
Please wait a minute before you try to comment again.
Add Chart to Comment
Confirm Block

Are you sure you want to block %USER_NAME%?

By doing so, you and %USER_NAME% will not be able to see any of each other's Investing.com's posts.

%USER_NAME% was successfully added to your Block List

Since you’ve just unblocked this person, you must wait 48 hours before renewing the block.

Report this comment

I feel that this comment is:

Comment flagged

Thank You!

Your report has been sent to our moderators for review
Continue with Google
or
Sign up with Email