
I’m not a momentum trader who seeks the hottest investment opportunities over the short run. Rather, I look at stocks at new highs. I believe that it’s a good sign when the stock is near all time highs or close to new 52-Week Highs.
Today I'm screening for large cap high yielders that are a few percentage points below new 52-Week Highs. It should be possible that these stocks can hit new highs in the near future.
Only fifteen stocks with more than USD 2 billion market capitalization are trading close to new highs and twelve of them have a current buy or better rating from investment firms. Two of the companies even have a double-digit dividend yield.
Vodafone Group (VOD) has a market capitalization of $165.34 billion. The company employs 91,272 people, generates revenue of $70.672 billion and has a net income of $1.070 billion. Vodafone Group’s earnings before interest, taxes, depreciation and amortization (EBITDA) amounts to $21.852 billion. The EBITDA margin is 30.92 percent (the operating margin is 10.64 percent and the net profit margin 1.51 percent).
Financial Analysis: The total debt represents 29.01 percent of Vodafone Group’s assets and the total debt in relation to the equity amounts to 57.92 percent. Due to the financial situation, a return on equity of 0.58 percent was realized by Vodafone Group. Twelve trailing months earnings per share reached a value of $0.13. Last fiscal year, Vodafone Group paid $1.62 in the form of dividends to shareholders. VOD shares are 0.82 percent below new 52-Week Highs.
Market Valuation: Here are the price ratios of the company: The P/E ratio is 251.38, the P/S ratio is 2.30 and the P/B ratio is finally 1.45. The dividend yield amounts to 4.68 percent and the beta ratio has a value of 0.65.
BP (BP) has a market capitalization of $132.38 billion. The company employs 85,700 people, generates revenue of $388.285 billion and has a net income of $11.816 billion. BP’s earnings before interest, taxes, depreciation and amortization (EBITDA) amounts to $39.891 billion. The EBITDA margin is 10.27 percent (the operating margin is 5.08 percent and the net profit margin 3.04 percent).
Financial Analysis: The total debt represents 16.26 percent of BP’s assets and the total debt in relation to the equity amounts to 41.21 percent. Due to the financial situation, a return on equity of 10.07 percent was realized by BP. Twelve trailing months earnings per share reached a value of $8.07. Last fiscal year, BP paid $1.98 in the form of dividends to shareholders. BP shares are 3.98 percent below new 52-Week Highs.
Market Valuation: Here are the price ratios of the company: The P/E ratio is 5.21, the P/S ratio is 0.34 and the P/B ratio is finally 1.13. The dividend yield amounts to 5.14 percent and the beta ratio has a value of 1.20.
Altria Group (MO) has a market capitalization of $70.88 billion. The company employs 9,100 people, generates revenue of $24.618 billion and has a net income of $4.183 billion. Altria Group’s earnings before interest, taxes, depreciation and amortization (EBITDA) amounts to $7.487 billion. The EBITDA margin is 30.41 percent (the operating margin is 25.91 percent and the net profit margin 16.99 percent).
Financial Analysis: The total debt represents 39.28 percent of Altria Group’s assets and the total debt in relation to the equity amounts to 438.07 percent. Due to the financial situation, a return on equity of 121.70 percent was realized by Altria Group. Twelve trailing months earnings per share reached a value of $2.19. Last fiscal year, Altria Group paid $1.70 in the form of dividends to shareholders. MO shares are 4.36 percent below new 52-Week Highs.
Market Valuation: Here are the price ratios of the company: The P/E ratio is 16.14, the P/S ratio is 2.88 and the P/B ratio is finally 22.43. The dividend yield amounts to 5.43 percent and the beta ratio has a value of 0.42.
National Grid (NGG) has a market capitalization of $43.67 billion. The company employs 25,224 people, generates revenue of $22.832 billion and has a net income of $3.650 billion. National Grid’s earnings before interest, taxes, depreciation and amortization (EBITDA) amounts to $8.330 billion. The EBITDA margin is 36.49 percent (the operating margin is 26.62 percent and the net profit margin 15.99 percent).
Financial Analysis: The total debt represents 51.36 percent of National Grid’s assets and the total debt in relation to the equity amounts to 274.69 percent. Due to the financial situation, a return on equity of 23.58 percent was realized by National Grid. Twelve trailing months earnings per share reached a value of $4.95. Last fiscal year, National Grid paid $3.25 in the form of dividends to shareholders. NGG shares are 4.61 percent below new 52-Week Highs.
Market Valuation: Here are the price ratios of the company: The P/E ratio is 12.03, the P/S ratio is 1.94 and the P/B ratio is finally 2.78. The dividend yield amounts to 5.31 percent and the beta ratio has a value of 0.61.
Take a closer look at the full list of High-Yield Large Caps near to new 52-Week Highs. The average P/E ratio amounts to 16.56 and forward P/E ratio is 13.46. The dividend yield has a value of 6.93 percent. Price to book ratio is 3.16 and price to sales ratio 3.41. The operating margin amounts to 36.37 percent and the beta ratio is 1.05. Stocks from the list have an average debt to equity ratio of 3.83.
Here is the full table with some fundamentals (TTM): 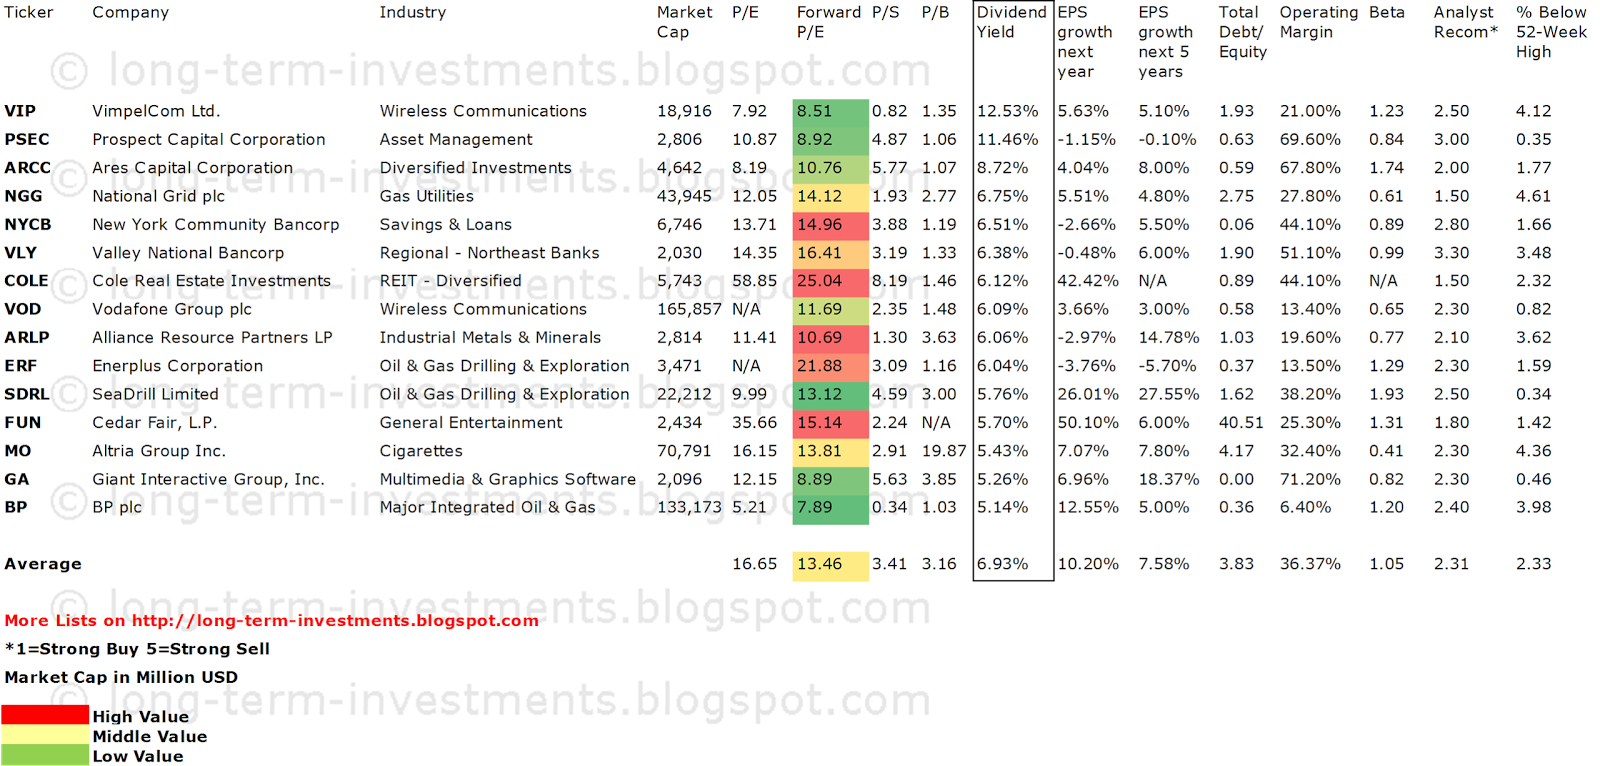
Related Stock Ticker Symbols:
VIP, PSEC, ARCC, NGG, NYCB, VLY, COLE, VOD, ARLP, ERF, SDRL, FUN, MO, GA, BP
Disclosure: I have no positions in any stocks mentioned, and no plans to initiate any positions within the next 72 hours. I receive no compensation to write about any specific stock, sector or theme.