
Dividend Aristocrats with low P/E’s and buying recommendations originally published at long-term-investments.blogspot.com. We all love a growing dividend and one of the most popular indices that cover the best dividend growth stocks is the S&P 500 Dividend Aristocrats index.
The index has currently 54 constituents. My goal in this article is to show you the currently cheapest stocks from the Dividend Aristocrats Index with current buy or better ratings.
I know, it’s a little bit easy to trust others work but the high-quality dividend stocks are already discovered. The only thing we must do is to screen the current valuations and market opinions.
Only twelve stocks fulfilled both, a forward P/E below 15 combined with a buy or better rating by brokerage firms. Half of the results have a projected double-digit mid-term earnings growth forecast.
I really like Dividend Aristocrats but because of the highly predictable business model and well known asset class, most of them are no longer cheap. Only eighteen stocks have an expected P/E under 15! That’s only one third of the full database and only around 20 percent of all Aristocrats are recommended to buy.
AbbVie (NYSE:ABBV) has a market capitalization of $69.58 billion. The company employs 21,500 people, generates revenue of $18.380 billion and has a net income of $5.275 billion. AbbVie’s earnings before interest, taxes, depreciation and amortization (EBITDA) amounts to $7.614 billion. The EBITDA margin is 41.43 percent (the operating margin is 31.65 percent and the net profit margin 28.70 percent).
Financial Analysis: The total debt represents 58.03 percent of AbbVie’s assets and the total debt in relation to the equity amounts to 466.01 percent. Due to the financial situation, a return on equity of 68.98 percent was realized by AbbVie. Twelve trailing months earnings per share reached a value of $3.25. Last fiscal year, AbbVie paid $1.60 in the form of dividends to shareholders. Forward P/E: 13.61.
Market Valuation: Here are the price ratios of the company: The P/E ratio is 13.49, the P/S ratio is 3.79 and the P/B ratio is finally 20.59. The dividend yield amounts to 3.65 percent and the beta ratio is not calculable.
Chevron (NYSE:CVX) has a market capitalization of $234.18 billion. The company employs 62,000 people, generates revenue of $241.909 billion and has a net income of $26.336 billion. Chevron’s earnings before interest, taxes, depreciation and amortization (EBITDA) amounts to $59.975 billion. The EBITDA margin is 24.79 percent (the operating margin is 19.15 percent and the net profit margin 10.89 percent).
Financial Analysis: The total debt represents 5.23 percent of Chevron’s assets and the total debt in relation to the equity amounts to 8.93 percent. Due to the financial situation, a return on equity of 20.30 percent was realized by Chevron. Twelve trailing months earnings per share reached a value of $12.34. Last fiscal year, Chevron paid $3.51 in the form of dividends to shareholders. Forward P/E: 9.93.
Market Valuation: Here are the price ratios of the company: The P/E ratio is 9.82, the P/S ratio is 0.97 and the P/B ratio is finally 1.73. The dividend yield amounts to 3.30 percent and the beta ratio has a value of 0.82.
Nucor (NYSE:NUE) has a market capitalization of $14.83 billion. The company employs 22,200 people, generates revenue of $19.429 billion and has a net income of $593.13 million. Nucor’s earnings before interest, taxes, depreciation and amortization (EBITDA) amounts to $1.665 billion. The EBITDA margin is 8.57 percent (the operating margin is 4.39 percent and the net profit margin 3.05 percent).
Financial Analysis: The total debt represents 26.24 percent of Nucor’s assets and the total debt in relation to the equity amounts to 48.60 percent. Due to the financial situation, a return on equity of 6.65 percent was realized by Nucor. Twelve trailing months earnings per share reached a value of $1.30. Last fiscal year, Nucor paid $1.46 in the form of dividends to shareholders. Forward P/E: 13.98.
Market Valuation: Here are the price ratios of the company: The P/E ratio is 35.72, the P/S ratio is 0.76 and the P/B ratio is finally 1.94. The dividend yield amounts to 3.15 percent and the beta ratio has a value of 1.03.
Johnson & Johnson (NYSE:JNJ) has a market capitalization of $245.62 billion. The company employs 127,600 people, generates revenue of $67.224 billion and has a net income of $10.514 billion. Johnson & Johnson’s earnings before interest, taxes, depreciation and amortization (EBITDA) amounts to $20.811 billion. The EBITDA margin is 30.96 percent (the operating margin is 20.49 percent and the net profit margin 15.64 percent).
Financial Analysis: The total debt represents 13.32 percent of Johnson & Johnson’s assets and the total debt in relation to the equity amounts to 24.94 percent. Due to the financial situation, a return on equity of 17.81 percent was realized by Johnson & Johnson. Twelve trailing months earnings per share reached a value of $4.50. Last fiscal year, Johnson & Johnson paid $2.40 in the form of dividends to shareholders. Forward P/E: 14.99.
Market Valuation: Here are the price ratios of the company: The P/E ratio is 19.37, the P/S ratio is 3.65 and the P/B ratio is finally 3.66. The dividend yield amounts to 3.03 percent and the beta ratio has a value of 0.62.
Take a closer look at the full list of cheap Dividend Aristocrats with buy or better rating. The average P/E ratio amounts to 20.82 and forward P/E ratio is 12.94. The dividend yield has a value of 2.50 percent. Price to book ratio is 4.03 and price to sales ratio 1.80. The operating margin amounts to 17.58 percent and the beta ratio is 1.10. Stocks from the list have an average debt to equity ratio of 0.77.
Here is the full table with some fundamentals (TTM):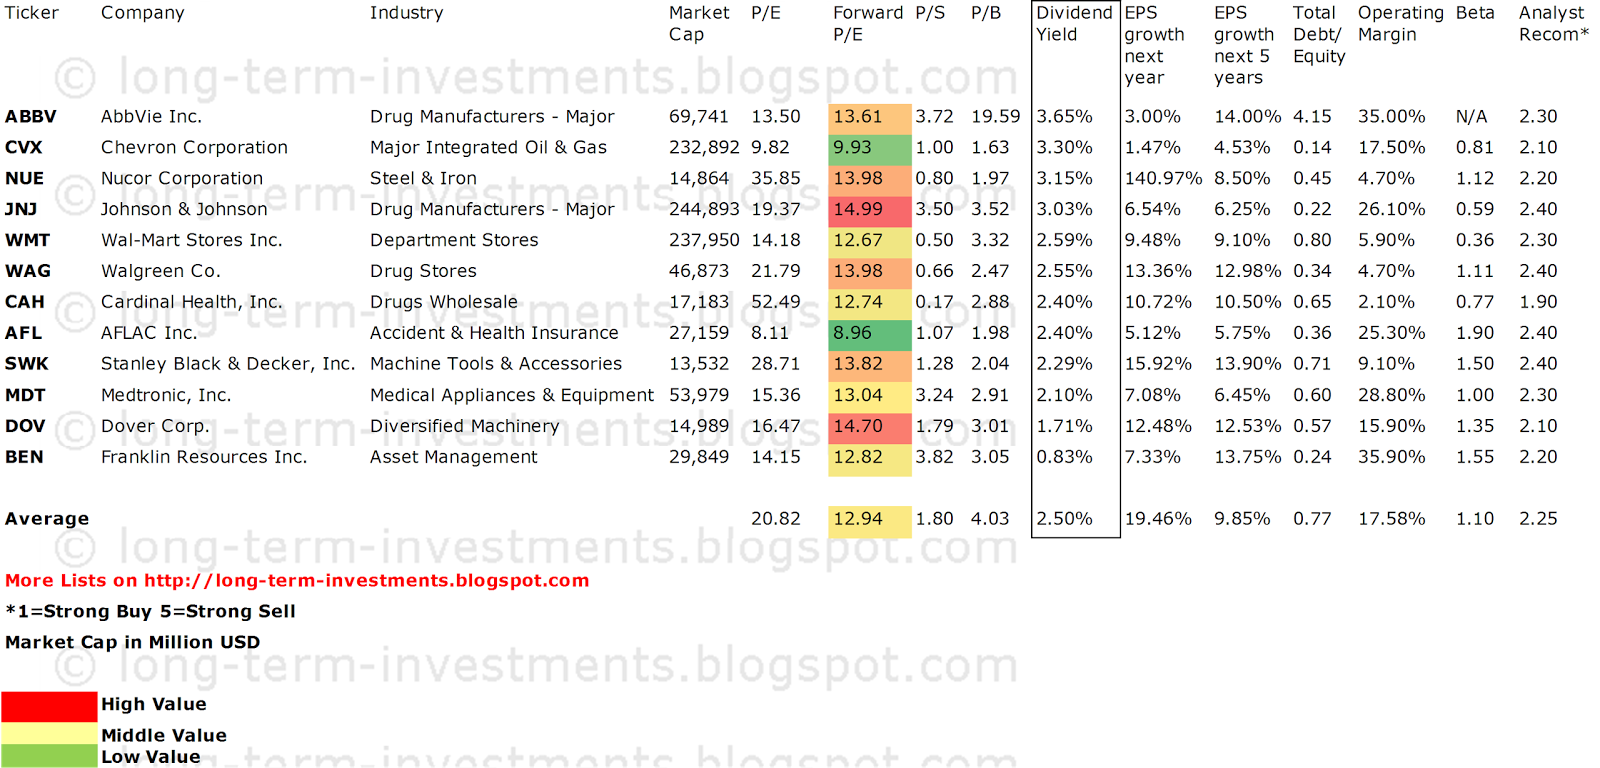
Related Stock Ticker Symbols:
ABBV, CVX, NUE, JNJ, WMT, WAG, CAH, AFL, SWK, MDT, DOV, BEN
*I am long JNJ, WMT, WAG, MDT. I receive no compensation to write about these specific stocks, sector or theme. I don't plan to increase or decrease positions or obligations within the next 72 hours.
For the other stocks: I have no positions in any stocks mentioned, and no plans to initiate any positions within the next 72 hours. I receive no compensation to write about any specific stock, sector or theme.
- English (UK)
- English (India)
- English (Canada)
- English (Australia)
- English (South Africa)
- English (Philippines)
- English (Nigeria)
- Deutsch
- Español (España)
- Español (México)
- Français
- Italiano
- Nederlands
- Português (Portugal)
- Polski
- Português (Brasil)
- Русский
- Türkçe
- العربية
- Ελληνικά
- Svenska
- Suomi
- עברית
- 日本語
- 한국어
- 简体中文
- 繁體中文
- Bahasa Indonesia
- Bahasa Melayu
- ไทย
- Tiếng Việt
- हिंदी
12 Cheap Dividend Aristocrats With Buy Or Better Ratings
Published 09/08/2013, 06:05 AM
Updated 07/09/2023, 06:31 AM
12 Cheap Dividend Aristocrats With Buy Or Better Ratings
3rd party Ad. Not an offer or recommendation by Investing.com. See disclosure here or
remove ads
.
Latest comments
Install Our App
Risk Disclosure: Trading in financial instruments and/or cryptocurrencies involves high risks including the risk of losing some, or all, of your investment amount, and may not be suitable for all investors. Prices of cryptocurrencies are extremely volatile and may be affected by external factors such as financial, regulatory or political events. Trading on margin increases the financial risks.
Before deciding to trade in financial instrument or cryptocurrencies you should be fully informed of the risks and costs associated with trading the financial markets, carefully consider your investment objectives, level of experience, and risk appetite, and seek professional advice where needed.
Fusion Media would like to remind you that the data contained in this website is not necessarily real-time nor accurate. The data and prices on the website are not necessarily provided by any market or exchange, but may be provided by market makers, and so prices may not be accurate and may differ from the actual price at any given market, meaning prices are indicative and not appropriate for trading purposes. Fusion Media and any provider of the data contained in this website will not accept liability for any loss or damage as a result of your trading, or your reliance on the information contained within this website.
It is prohibited to use, store, reproduce, display, modify, transmit or distribute the data contained in this website without the explicit prior written permission of Fusion Media and/or the data provider. All intellectual property rights are reserved by the providers and/or the exchange providing the data contained in this website.
Fusion Media may be compensated by the advertisers that appear on the website, based on your interaction with the advertisements or advertisers.
© 2007-2024 - Fusion Media Limited. All Rights Reserved.