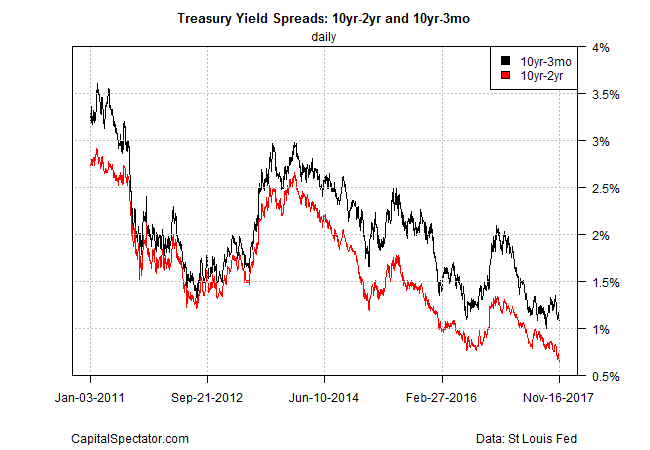
The debate about the value of the Treasury spread for business-cycle analysis is set to intensify in the wake of the latest slide in the difference between the 10-year and 2-year rates. Although the US economic trend remains healthy, the ongoing decline in the yield spread implies trouble ahead, based on this indicator’s historical record.
US recessions over the last four decades have been preceded by a falling yield spread that lifts the 2-year rate above the 10-year rate – an inverted yield curve. Although the spread is still positive, the difference has narrowed to a relatively thin 65 basis points as of yesterday (Nov. 17) – the smallest spread in ten years. Note, however, that the 10-year/3-month spread has been comparatively stable recently, offering a mild counterpoint to the dark clouds linked with the 10-year/2-year data.
The primary driver of the falling spread is the surge in the policy sensitive 2-year yield, which rose to 1.72% on Thursday (based on daily data via Treasury.gov). That’s the highest yield in nine years for this maturity. The benchmark 10-year rate, by contrast, has been relatively steady this year. As of yesterday, the 2.37% for the 10-year Note is fractionally below the yield on the first trading day of the year.
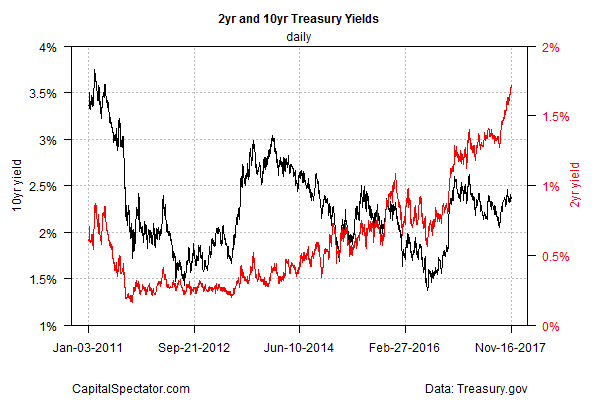
“This [flattening] is a reflection that the Fed is still going ahead with raising rates even though inflation remains quite low,” Lou Brien, market strategist at DRW Trading, tells Reuters.
Some analysts are expecting that the yield curve will continue to flatten. “The peak yield on the 10-year Treasury should roughly approximate where the final level of fed funds settles out, so that to us implies a flat yield curve if we assume the Fed will do two or three hikes in 2018,” says Mark Vaselkiv, chief investment officer of fixed income at T. Rowe Price.
The question is whether the falling spread is signaling rising recession risk? Unlikely, reasons Charles Lieberman, chief investment officer at Advisors Capital Management. Writing for Bloomberg this week, he points out that a closer look at the historical record reveals that the 10-year/2-year’s warning “has varied sufficiently that an inversion can only be considered a weak signal, at best, of an impending economic decline.”
Lieberman goes on to advise that the real risk for the economy at this stage would be a sharp rise in inflation from currently low levels. This “would signal that the Fed has been insufficiently preemptive in its policy action.”
Investors would also quickly understand that the yields on their bonds are too low and bond prices will plummet and the curve will suddenly steepen. This is the basis for the “Bondmageddon” thesis espoused in some circles. And the risk to the economy of a downturn would then become very real. Be concerned about the possibility of a sudden steepening of the yield curve, not of the gradual flattening that has taken place.
For the moment, the probabilities are low that an NBER-recession is near. GDP growth in the past two quarters has been a strong 3% and a repeat performance is expected for Q4, based on the Atlanta Fed’s estimate and the outlook via Wall Street economists.
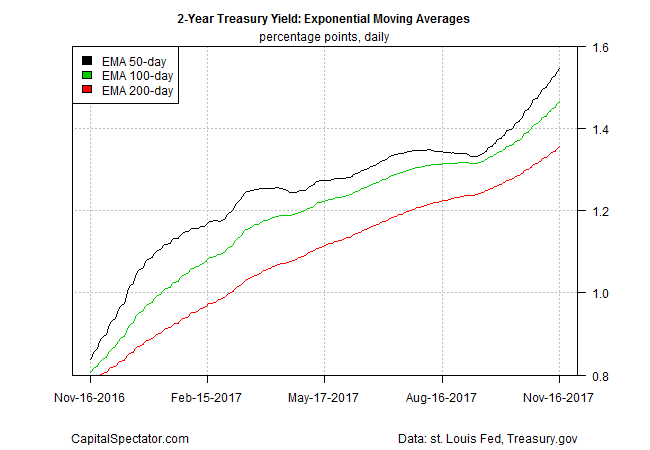
Meantime, the 2-year yield appears poised to rise further, based on a set of exponential moving averages (EMAs).
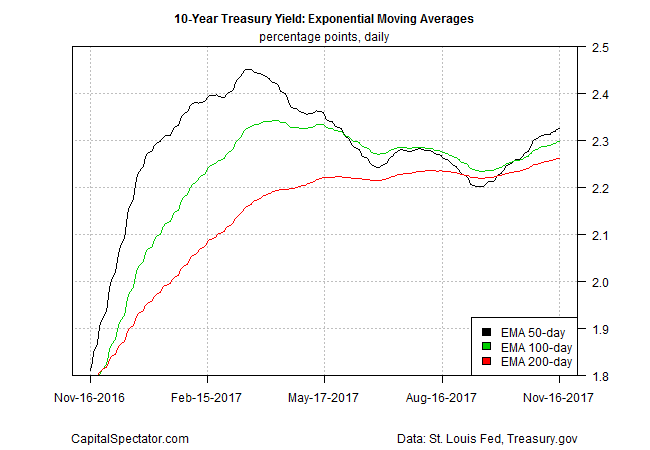
EMAs for the 10-year rate have recently shifted to an upside bias, which suggests that the narrowing of the 10-year/2-year spread has run its course for the near term.
As for Lieberman’s argument that sharply higher inflation is the true threat for the business cycle at this stage, the Treasury market’s downplaying that risk. The implied inflation forecasts via nominal and inflation-indexed Treasuries continue to anticipate that the pricing trend will remain below the Fed’s 2.0% target for the foreseeable future.
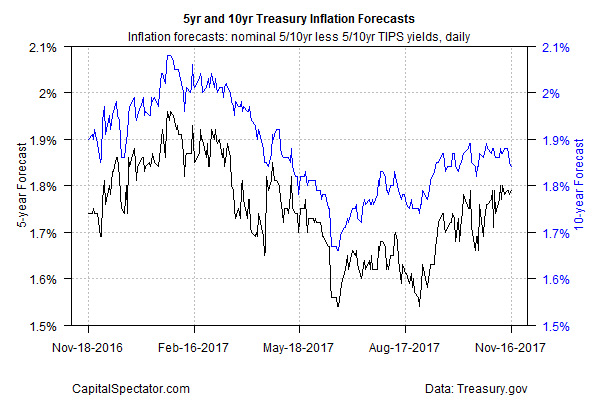
If Lieberman’s thesis is correct, the recent decline in the 10-year/2-year spread isn’t a warning sign for US economy.
Perhaps, but the case for monitoring the business cycle closely and frequently is no less compelling. A new recession may or may not be brewing, but all the usual caveats apply, starting with the empirical evidence that whenever the next downturn starts it will only be obvious after the fact. The good news is that estimating recession risk intelligently can reduce the lag between when a recession starts and the subsequent signal that can be extracted from the data. The first order of business: recognize that no one indicator is flawless. In other words, using a diversified set of indicators to monitor recession risk in real time is the only game in town for minimizing the possibility of getting blindsided by false signals.
