U.S. CDC SAYS NOW IS THE TIME FOR BUSINESSES, HOPSTIALS, COMMUNITIES AND SCHOOLS TO BEGIN PREPARING TO RESPOND TO CORONAVIRUS – TELEBRIEFING
U.S. CDC SAYS WANTS TO PREPARE AMERICAN PUBLIC FOR POSSIBILITY THAT THEIR LIVES WILL BE DISRUPTED AS CORONAVIRUS SPREADS IN U.S. – TELEBRIEFING
U.S. CDC: “VERY STRONG CHANCE OF AN EXTREMELY SERIOUS OUTBREAK OF THE CORONAVIRUS HERE IN THE UNITED STATES.
…….and with those comments, the selloff on Wall Street continues. The S&P 500 is down an additional 3.25% and the Dow Jones is down an additional 3.1% from yesterday. Of course, because the stock markets are selling off from all-time highs, that means the dips have ALWAYS been bought at some point. But that is for another day.
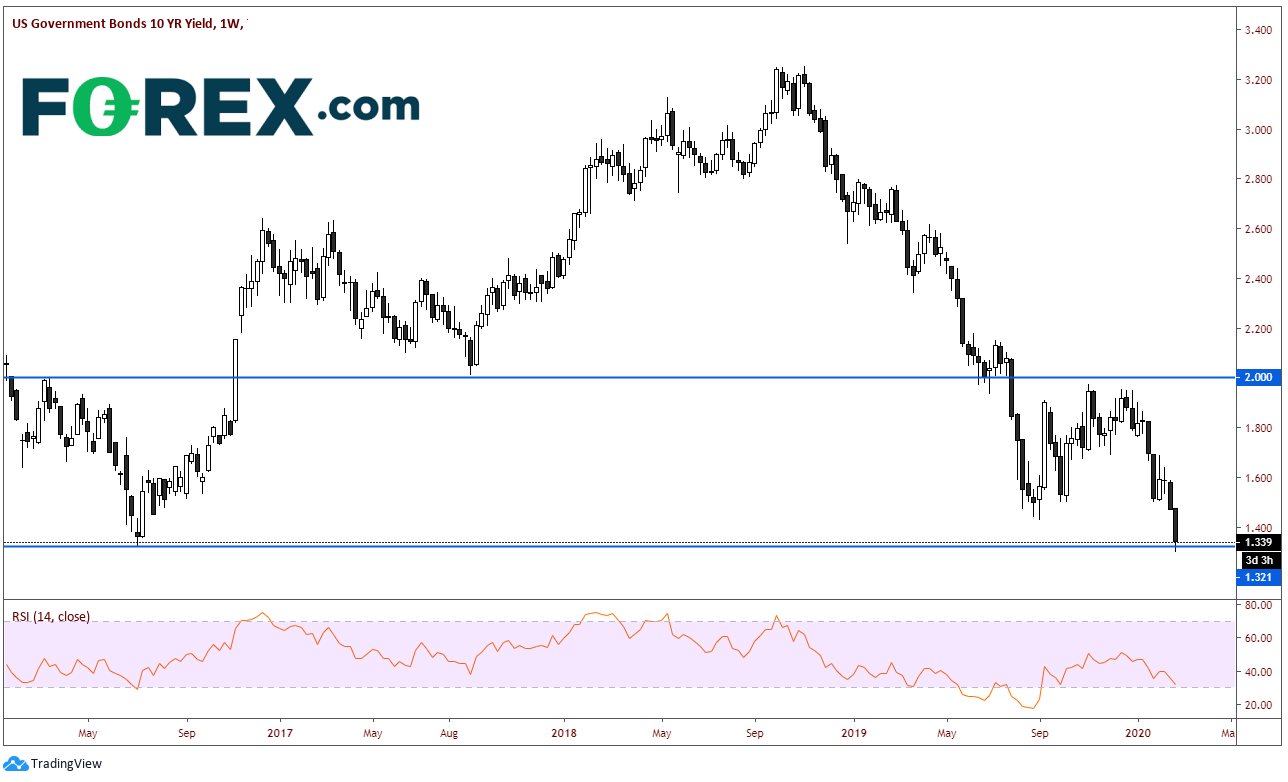
Today, 10-year government bond yields have made all-time new lows, trading as low as 1.303% vs the previous low in July 2016 at 1.321%.

Source: Tradingview, FOREX.com
The flight to safety into bonds was in play again today as bonds were bought while stocks were being sold:
- Stocks and bonds have an inverse relationship with each other. When stocks move lower, bonds traditionally move higher.
- Bonds and yields are inversely related. As bonds move higher, yields move lower.
- As a result, when stocks move lower, yields move lower as well.
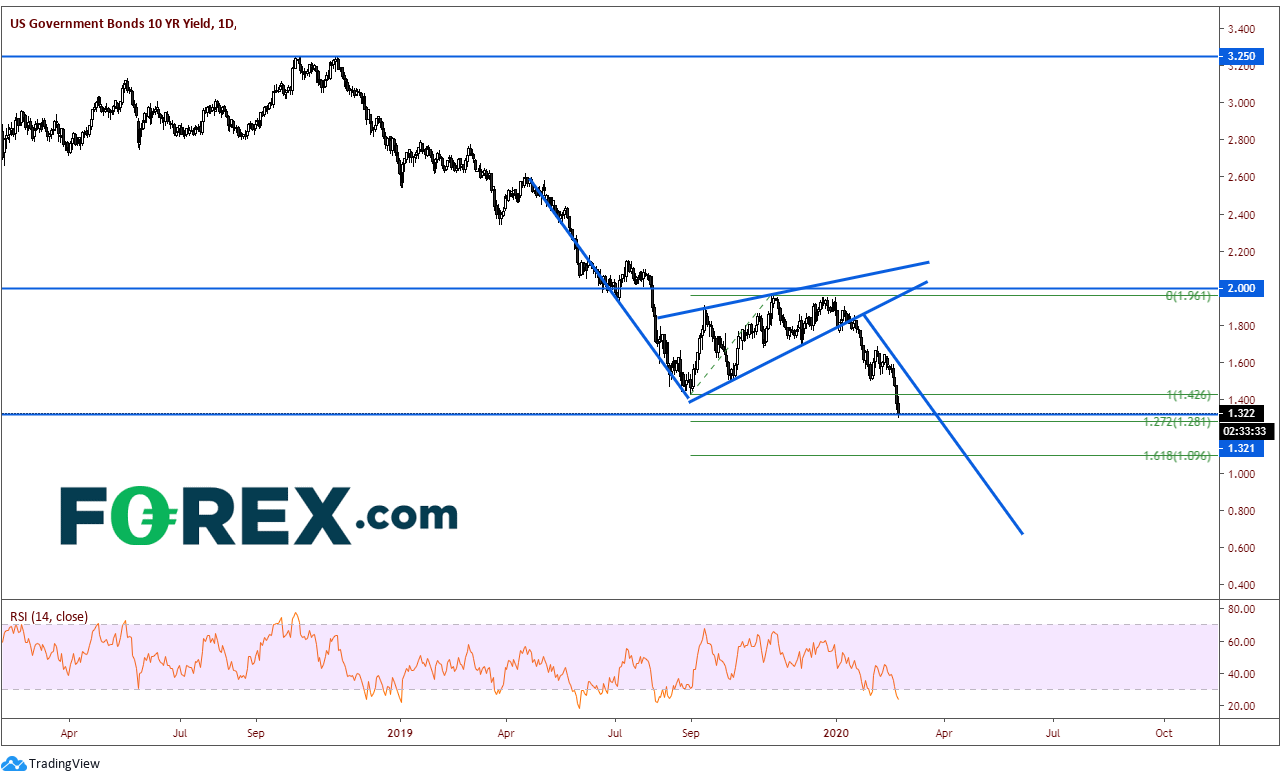
Taking a conservative approach to the pennant formation in 10-year yields, the target is near .67%. If one chooses to look for a more aggressive target, he or she can extend the length of the flagpole towards 3.25%, then take the flagpole and add it to the breakdown out of the pennant. However, before the target is support at the 127.2% and 1.618% Fibonacci extensions near 1.281% and 1.096%, respectively. In addition, watch the RSI, as it has moved into oversold territory. This indicates that if price is to reach the target, there will most likely be a bounce first.

Source: Tradingview, FOREX.com
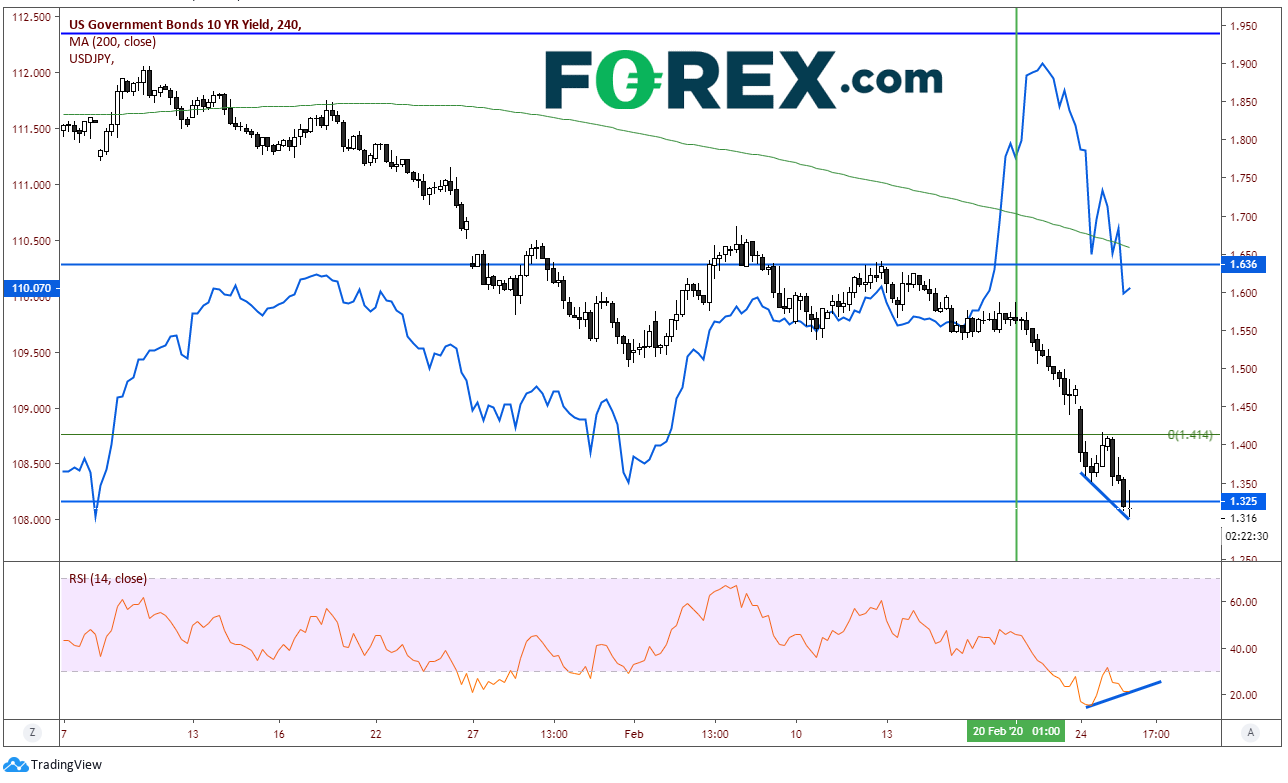
When we overlay USD/JPY on the 10-year yields, we can see that, for the most part, these 2 assets are correlated. When USD/JPY moves lower, 10-year yields move lower. We can see this on a 240-minute time frame, with the inexplicit runup in USD/JPY early last week being the exception (blue line). The scale of the left side show price for USD/JPY, which is currently near 110.00. This big round number acts as psychological support. Note that on the shorter-term timeframe, yields and the RSI are diverging. If yields do bounce soon, USD/JPY sellers will be looking to enter the market near yesterdays support (now acting as resistance) near 110.30.

Source: Tradingview, FOREX.com
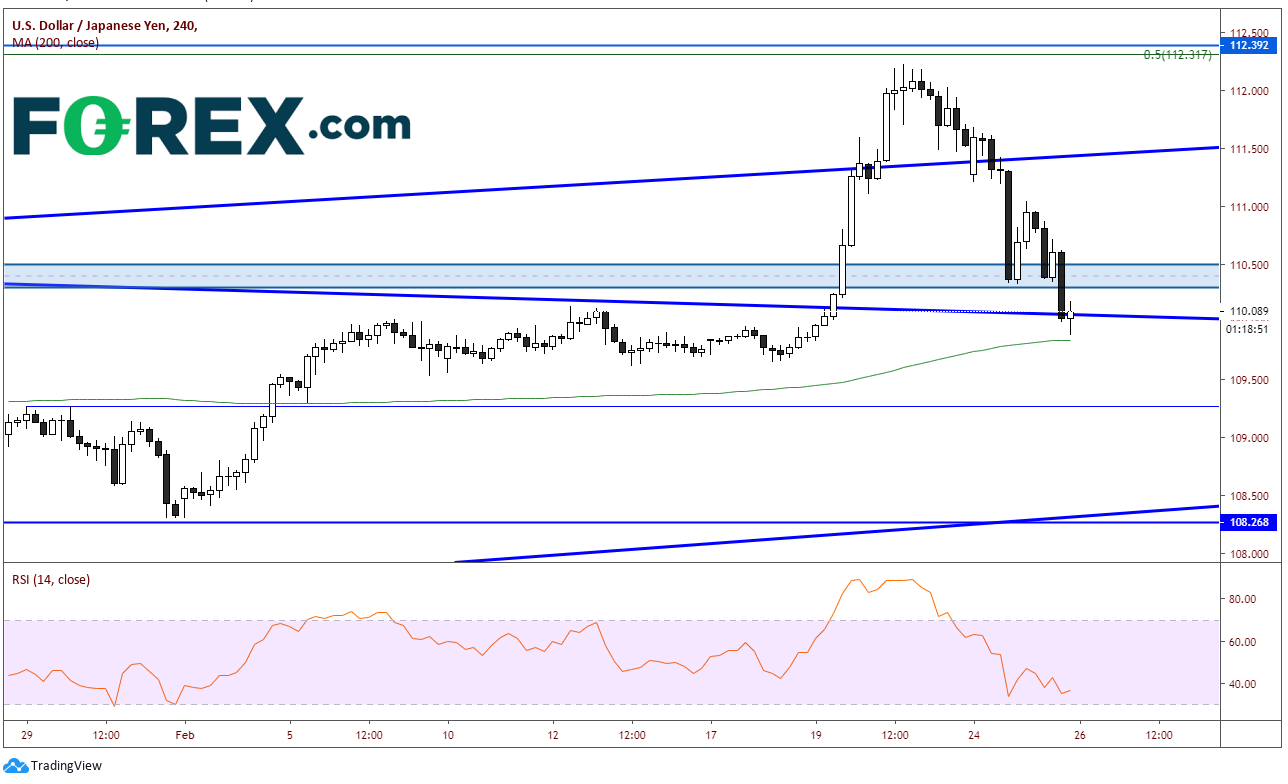
On a 240-minute timeframe, USD/JPY has put in a doji candle, a candle of indecision. This may also indicate that the pair is ready for a bounce (and a bond pullback). Again, expect resistance and sellers at 110.30.

Source: Tradingview, FOREX.com
10-year yields are another asset class one can watch when trading USD/JPY. Because they are correlated, if we see a bounce in yields, we can expect a possible bounce in USD/JPY.
