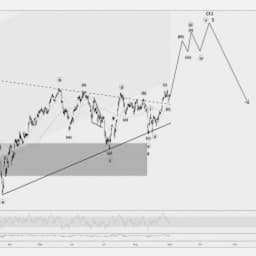
What does the technical picture tell us about the 10-Year US Treasury yield? The pale green area in the chart below is a rising trend channel. Rates rose within that channel since the mid-2016 secular low. It got broken to the downside during late 2018. The break occurred within the swing that is encapsulated by the pale grey trend channel.
The swing within the pale grey trend channel is labeled as minor wave A. It counts as an impulse within the Elliott wave framework. An impulse at this particular junction implies that there is some form of follow-up move on the downside. The subsequent corrective action from the early 2019 low supports this interpretation. An overlapping and choppy rebound unfolded from the January 4th, 2019 low until today. This is typical for corrective price action. Hence, the dominating trend is most likely to the downside. It just gets corrected since early this year.
How long is the corrective action likely to persist until the paramount trend regains control? There are a few hints that suggest a nearby resolution to the downside. The correction appears to unfold sideways. The pattern within the first couple of waves from the early 2019 low excludes most of the deeper upside scenarios within the Elliott wave framework. One more spike to the upside completes a double zig-zag correction for example. That is a terminal pattern, which could retest the bottom of the rising pale green trend channel. A retest is typical whenever larger trends or important support/resistance levels get broken. Therefore, the red scenario fits well into the bigger picture. However, a retest is not required. The spike that is labeled as minor wave B (black color) can be interpreted as a failed retest already. It merely means that rates could resolve to the downside at any time without striking another recovery high. The best hint that the trend turned down already is if the dotted black line gets crossed to the downside. It runs at roughly 2.54%, which is the early 2019 rates low.

What is likely to happen after a downside resolution? A few scenarios are possible. The most likely scenario is an equidistant zig-zag, which unfolds to the downside. That implies a projection below 2% in the 10y US Treasury yield. This projection is the best possible forecast within the Elliott wave framework with the technical information that is available today.
All in all, the US Treasury rates cycle, which unfolds since late 2018 is probably incomplete. There will be at least a few more months of falling rates in 10-year US Treasuries. The setup is tradable and suggests a positive outlook for holding US Treasuries.