These days, you can be forgiven for thinking a wave of bankruptcies is going to hit your portfolio (and your dividends!). But there’s no need to worry: this so-called “wave” is way overhyped—in fact, it could send your portfolio higher.
It’s just one more upside-down thing we investors have to deal with in this crisis.
And get this: you could line yourself up for triple-digit returns (and 8%+ dividends!) if you tap into investors’ (overwrought) bankruptcy fears through a corporate-bond-focused closed-end fund (CEF). I’ll have a ticker (paying a monthly dividend yielding 9.2%) in a moment.
First, let’s dispel one myth: that COVID-19 is behind all the bankruptcies we’re hearing about these days.
Nonsense.
Of course, in some cases, the pandemic is the problem (with New York City clothing chain Century 21, for example). But for every Century 21 there’s a Modell’s Sporting Goods, which filed for bankruptcy on March 11, too early for COVID-19 to be the reason. The real problem was plummeting sales during the holiday season, in part because Walmart (NYSE:WMT) and Amazon (NASDAQ:AMZN) were proving more popular among convenience-focused shoppers.
Even companies that were right in the virus’s path, like those in the hard-hit travel sector, weren’t all driven into creditor protection just because of the disease. Perhaps the highest-profile bankruptcy was car-rental giant Hertz (NYSE:HTZ). But if the pandemic was the only culprit in Hertz’s demise, why hasn’t Avis (NASDAQ:CAR) also gone bust?
Avis Steers Through COVID. Hertz Hits The Wall
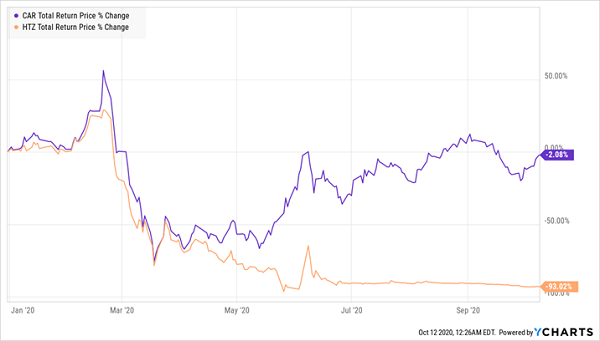
To make a long story short, Hertz used a dizzying corporate structure that meant it was not in a position to pay its bills during a rough period; Avis didn’t make that mistake, which is why its shares are only down 2% year to date, instead of 93%.
Great Bond Plays Still Around
The key takeaway is that the bankruptcy picture is a lot more nuanced than just a straight cause-and-effect relationship with COVID-19. Companies that can, and do, respond swiftly and intelligently to a crisis, and those with healthy balance sheets to help them withstand the disruption, have been able to survive the lean months of 2020. As the economy slowly returns to normal, those companies are positioned to return their profits to normal, too.
Bond investors are keenly aware of this, and most have been investing rationally for a post–COVID-19 world. With American GDP growth likely to reach 23% in the third quarter, the economy is getting back on its feet, albeit with some drag from physical distancing and consumer fears about going out and catching the virus. This is what the bond market indicates.
Junk Bonds See A Discount
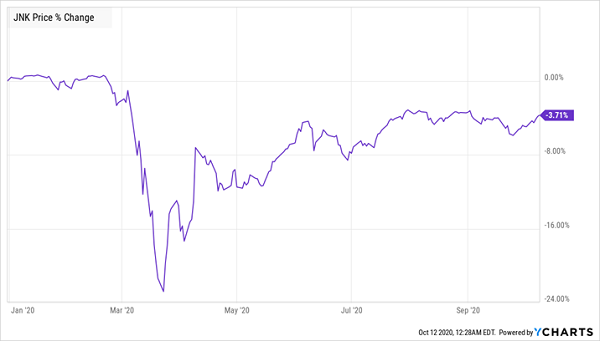
The SPDR Bloomberg Barclays (LON:BARC), the index fund tracking the high-yield corporate-bond market, is down 3.7% from the start of 2020. That pullback, plus the fund’s 5.7% dividend—eight times the pathetic 0.7% yield on a 10-year Treasury note!—makes JNK appealing now.
That’s doubly true when you consider that many of the weakest hands in this market—the Modell’s and Century 21s—have already folded. That leaves the survivors in position to take the market share of their now-defunct competitors as the economy improves.
This doesn’t mean you should buy JNK now, however. That’s because the corporate-bond market isn’t as “democratic” as the stock market. When new bonds are issued, top fund managers at major investment houses get the first pick. And because JNK is run by an algorithm, it doesn’t get that advantage. Instead, it’s stuck indiscriminately buying a bunch of junk bonds from across the market.
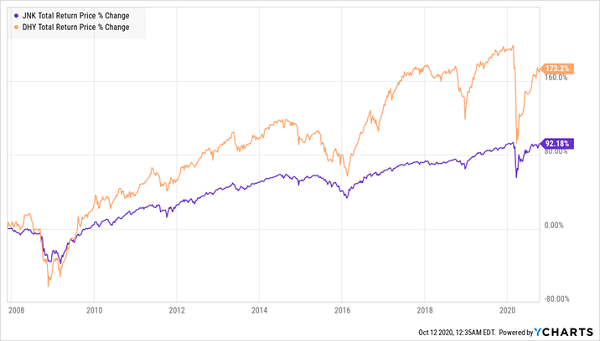
You can see this in just about every comparison between JNK and an actively managed CEF. The Credit Suisse High Yield Bond Fund (NYSE:DHY), for example has posted a 173% total return since JNK’s inception—far more than the ETF delivered.
1 Click To Crush The Market
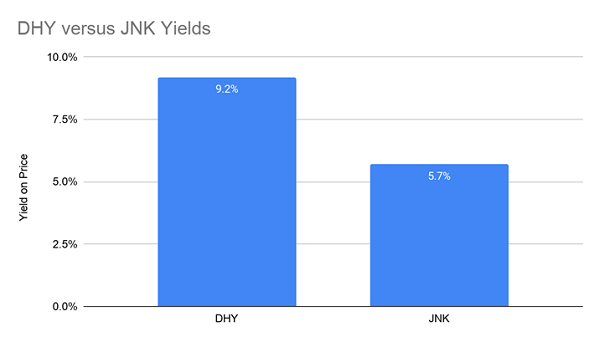
Plus, DHY’s yield easily beats JNK’s payout.
There’s one more advantage to investing in DHY over its ETF counterpart: the CEF trades at a 10.3% discount to net asset value (NAV, or the value of the bonds in its portfolio). This gives DHY additional upside as investors bid its market price closer to its underlying value.
JNK? Like all ETFs, it always trades at the market value of its holdings (or within such a small margin that it never makes a difference).
Main Corporate-Bond ETF Is Never A Bargain
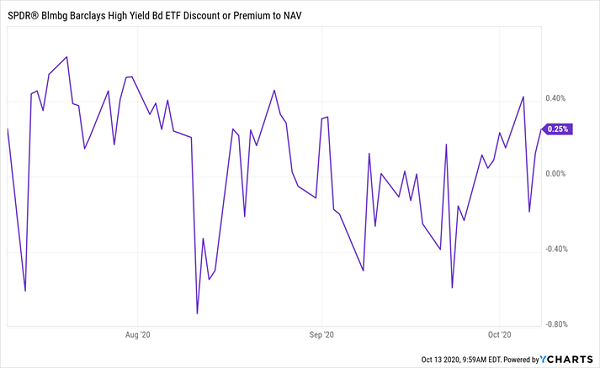
Why would you go for the index fund when it returns less, yields less and costs more than the comparable CEF? And buying JNK is particularly risky now, when the junk-bond market requires more care and research (to avoid the next Hertz) than ever.
Disclosure: Brett Owens and Michael Foster are contrarian income investors who look for undervalued stocks/funds across the U.S. markets. Click here to learn how to profit from their strategies in the latest report, "7 Great Dividend Growth Stocks for a Secure Retirement."
