There are a number of great companies in the market today. I’ve selected the highest dividend yields among the undervalued companies for defensive dividend stock investors reviewed by ModernGraham. Each company has been determined to be suitable for the Defensive Investor according to the ModernGraham approach.
Defensive Investors are defined as investors who are not able or willing to do substantial research into individual investments, and therefore need to select only the companies that present the least amount of risk. Enterprising Investors, on the other hand, are able to do substantial research and can select companies that present a moderate (though still low) amount of risk. Each company suitable for the Defensive Investor is also suitable for Enterprising Investors.
The companies selected for this list may not pay what some consider to be a huge dividend, but they have demonstrated strong financial positions through passing the rigorous requirements of the Defensive Investor and show potential for capital growth based on their current price in relation to intrinsic value. As such, these defensive dividend stocks may be a great investment if they prove to be suitable for your portfolio after your own additional research.
Gap Inc (NYSE:GPS)
Gap Inc qualifies for both the Defensive Investor and the Enterprising Investor. The Defensive Investor is only initially concerned with the low current ratio. The Enterprising Investor has no initial concerns. As a result, all value investors following the ModernGraham approach should feel comfortable proceeding with the analysis.
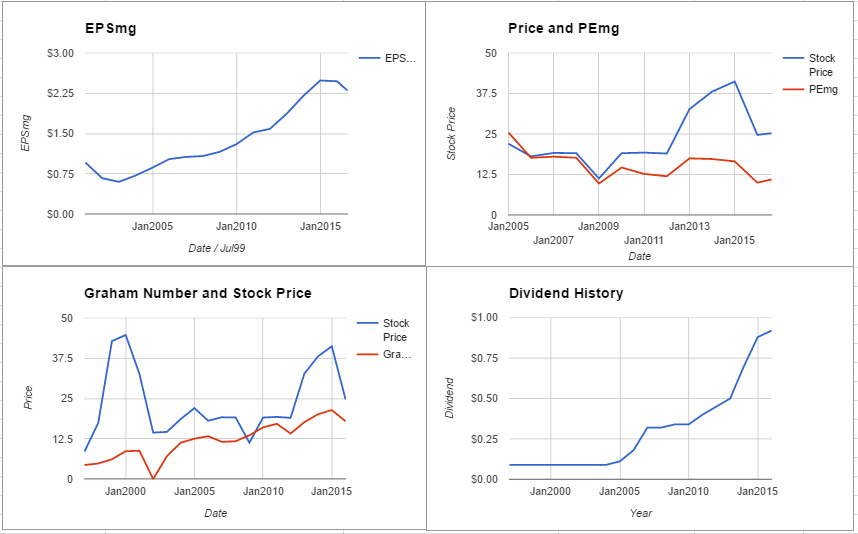
As for a valuation, the company appears to be Undervalued after growing its EPSmg (normalized earnings) from $1.87 in 2013 to an estimated $2.3 for 2017. This level of demonstrated earnings growth outpaces the market’s implied estimate of 1.25% annual earnings growth over the next 7-10 years. As a result, the ModernGraham valuation model, based on the Benjamin Graham value investing formula, returns an estimate of intrinsic value above the price.
At the time of valuation, further research into Gap Inc revealed the company was trading above its Graham Number of $16.15. The company pays a dividend of $0.92 per share, for a yield of 3.6%, putting it among the best dividend paying stocks today. Its PEmg (price over earnings per share – ModernGraham) was 10.99, which was below the industry average of 26.26, which by some methods of valuation makes it one of the most undervalued stocks in its industry. Finally, the company was trading above its Net Current Asset Value (NCAV) of $-2.61.
Invesco Plc (NYSE:IVZ)
Invesco Ltd. qualifies for both the Defensive Investor and the Enterprising Investor. The Defensive Investor is only initially concerned with the low current ratio. The Enterprising Investor has concerns regarding the level of debt relative to the current assets. As a result, all value investors following the ModernGraham approach should feel comfortable proceeding with the analysis.
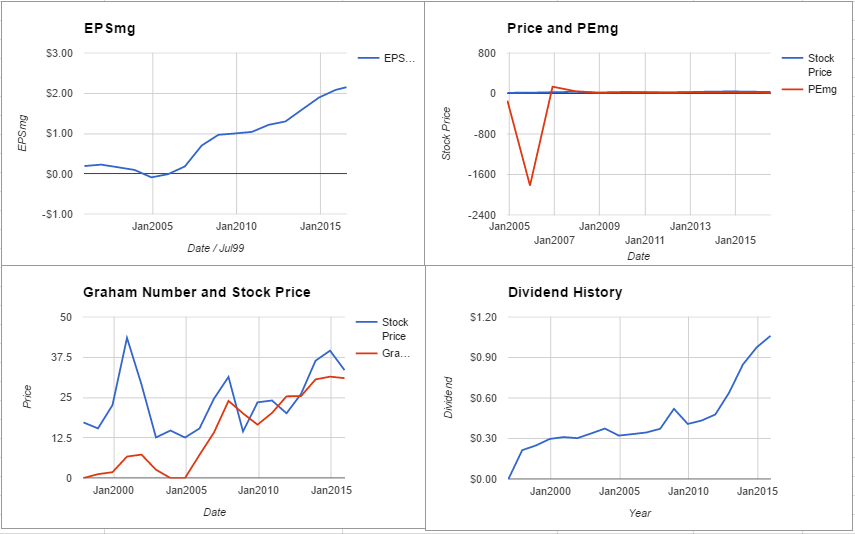
As for a valuation, the company appears to be Undervalued after growing its EPSmg (normalized earnings) from $1.3 in 2012 to an estimated $2.15 for 2016. This level of demonstrated earnings growth outpaces the market’s implied estimate of 2.37% annual earnings growth over the next 7-10 years. As a result, the ModernGraham valuation model, based on Benjamin Graham’s formula, returns an estimate of intrinsic value above the price.
Equity Residential (NYSE:EQR)
Equity Residential qualifies for both the Defensive Investor and the Enterprising Investor. The Defensive Investor is only initially concerned with the low current ratio. The Enterprising Investor has concerns regarding the level of debt relative to the current assets. As a result, all value investors following the ModernGraham approach should feel comfortable proceeding with the analysis.
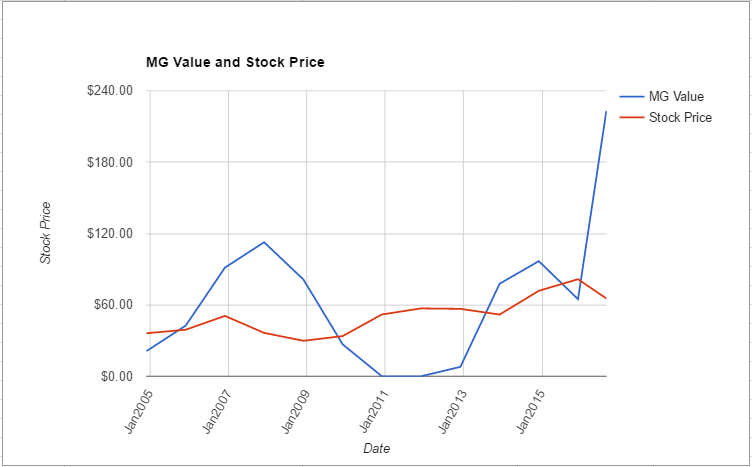
As for a valuation, the company appears to be Undervalued after growing its EPSmg (normalized earnings) from $2.15 in 2012 to an estimated $5.79 for 2016. This level of demonstrated earnings growth outpaces the market’s implied estimate of 1.39% annual earnings growth over the next 7-10 years. As a result, the ModernGraham valuation model, based on the Benjamin Graham value investing formula, returns an estimate of intrinsic value above the price.
At the time of valuation, further research into Equity Residential revealed the company was trading below its Graham Number of $90.07. The company pays a dividend of $2.11 per share, for a yield of 3.2%, putting it among the best dividend paying stocks today. Its PEmg (price over earnings per share – ModernGraham) was 11.29, which was below the industry average of 34.03, which by some methods of valuation makes it one of the most undervalued stocks in its industry. Finally, the company was trading above its Net Current Asset Value (NCAV) of $-24.85. (See the full valuation)
Dow Chemical Co (NYSE:DOW)
Dow Chemical Co qualifies for both the Defensive Investor and the Enterprising Investor. The Defensive Investor is only initially concerned with the low current ratio. The Enterprising Investor is only concerned with the level of debt relative to the net current assets. As a result, all value investors following the ModernGraham approach should feel comfortable proceeding with the analysis.
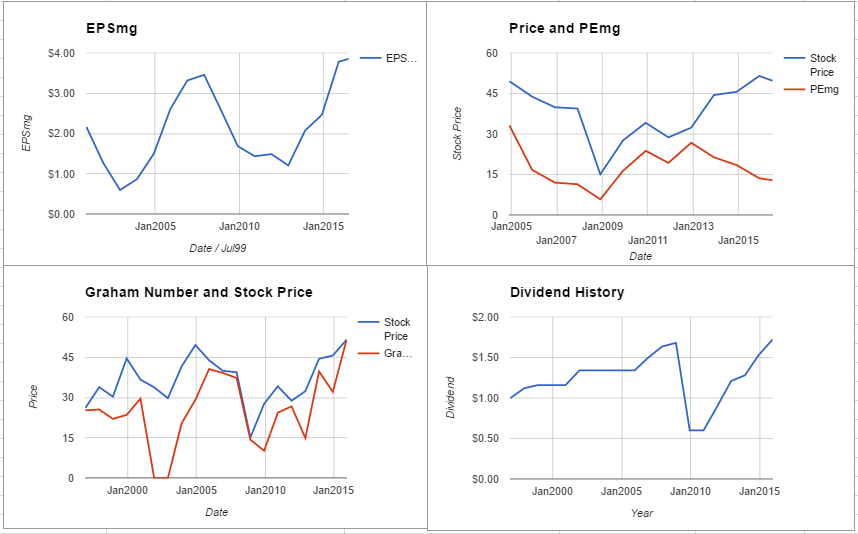
As for a valuation, the company appears to be Undervalued after growing its EPSmg (normalized earnings) from $1.21 in 2012 to an estimated $3.85 for 2016. This level of demonstrated earnings growth outpaces the market’s implied estimate of 2.2% annual earnings growth over the next 7-10 years. As a result, the ModernGraham valuation model, based on Benjamin Graham’s formula, returns an estimate of intrinsic value above the price. (See the full valuation)
Qualcomm Incorporated (NASDAQ:QCOM)
QUALCOMM, Inc. qualifies for both the Defensive Investor and the Enterprising Investor. The Defensive Investor is only initially concerned with the high PB ratio. The Enterprising Investor has no initial concerns. As a result, all value investors following the ModernGraham approach should feel comfortable proceeding with the analysis.
As for a valuation, the company appears to be Undervalued after growing its EPSmg (normalized earnings) from $2.49 in 2012 to an estimated $3.82 for 2016. This level of demonstrated earnings growth outpaces the market’s implied estimate of 4% annual earnings growth over the next 7-10 years. As a result, the ModernGraham valuation model, based on the Benjamin Graham value investing formula, returns an estimate of intrinsic value above the price.
At the time of valuation, further research into QUALCOMM, Inc. revealed the company was trading above its Graham Number of $42.34. The company pays a dividend of $1.97 per share, for a yield of 3.1%, putting it among the best dividend paying stocks today. Its PEmg (price over earnings per share – ModernGraham) was 16.5, which was below the industry average of 35.13, which by some methods of valuation makes it one of the most undervalued stocks in its industry. Finally, the company was trading above its Net Current Asset Value (NCAV) of $0.57. (See the full valuation)
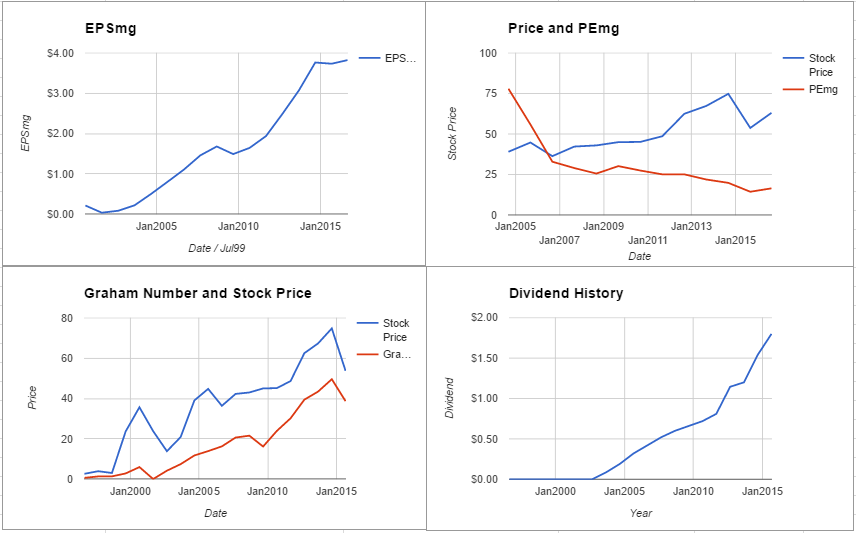
T. Rowe Price Group Inc (TROW)
T. Rowe Price Group Inc qualifies for both the Defensive Investor and the Enterprising Investor. The Defensive Investor is only initially concerned with the high PB ratio. The Enterprising Investor has no initial concerns. As a result, all value investors following the ModernGraham approach should feel comfortable proceeding with the analysis.
As for a valuation, the company appears to be Undervalued after growing its EPSmg (normalized earnings) from $2.75 in 2012 to an estimated $4.22 for 2016. This level of demonstrated earnings growth outpaces the market’s implied estimate of 3.89% annual earnings growth over the next 7-10 years. As a result, the ModernGraham valuation model, based on the Benjamin Graham value investing formula, returns an estimate of intrinsic value above the price.
At the time of valuation, further research into T. Rowe Price Group Inc revealed the company was trading above its Graham Number of $41.69. The company pays a dividend of $2.12 per share, for a yield of 3.1%, putting it among the best dividend paying stocks today. Its PEmg (price over earnings per share – ModernGraham) was 16.27, which was below the industry average of 19.87, which by some methods of valuation makes it one of the most undervalued stocks in its industry. Finally, the company was trading above its Net Current Asset Value (NCAV) of $-0.07.
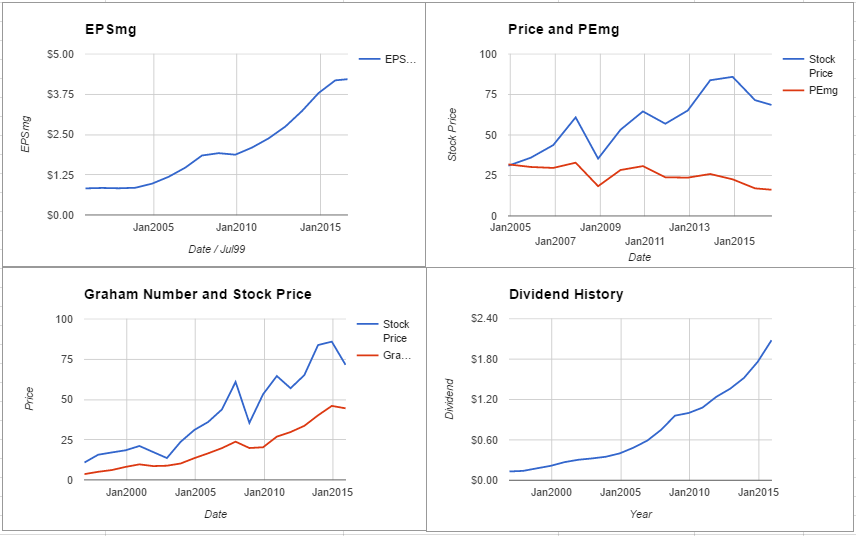
Wells Fargo & Co (NYSE:WFC)
Wells Fargo & Co qualifies for both the Defensive Investor and the Enterprising Investor. In fact, the company meets all of the requirements of both investor types, a rare accomplishment indicative of the company’s strong financial position. The Enterprising Investor has no initial concerns. As a result, all value investors following the ModernGraham approach should feel comfortable proceeding with the analysis.
As for a valuation, the company appears to be Undervalued after growing its EPSmg (normalized earnings) from $2.59 in 2012 to an estimated $3.93 for 2016. This level of demonstrated earnings growth outpaces the market’s implied estimate of 1.56% annual earnings growth over the next 7-10 years. As a result, the ModernGraham valuation model, based on Benjamin Graham’s formula, returns an estimate of intrinsic value above the price.
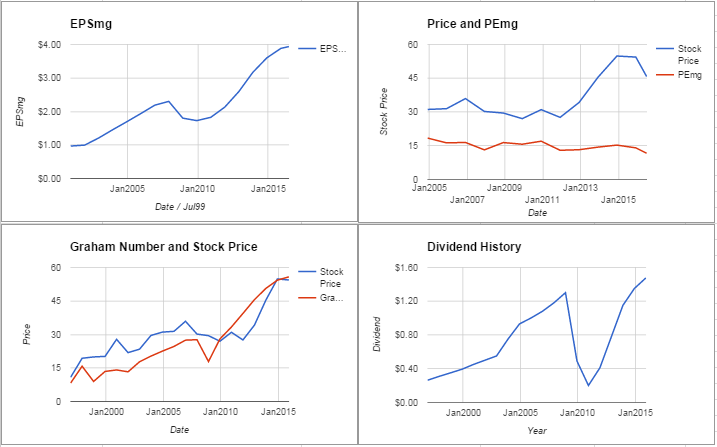
Aflac Incorporated (NYSE:AFL)
AFLAC Incorporated qualifies for both the Defensive Investor and the Enterprising Investor. In fact, the company meets all of the requirements of both investor types, a rare accomplishment indicative of the company’s strong financial position. The Enterprising Investor has no initial concerns. As a result, all value investors following the ModernGraham approach should feel comfortable proceeding with the analysis.
As for a valuation, the company appears to be Undervalued after growing its EPSmg (normalized earnings) from $4.72 in 2012 to an estimated $6.22 for 2016. This level of demonstrated earnings growth outpaces the market’s implied estimate of 1.36% annual earnings growth over the next 7-10 years. As a result, the ModernGraham valuation model, based on Benjamin Graham’s formula, returns an estimate of intrinsic value above the price.
At the time of valuation, further research into AFLAC Incorporated revealed the company was trading below its Graham Number of $87.98. The company pays a dividend of $1.64 per share, for a yield of 2.3%, putting it among the best dividend paying stocks today. Its PEmg (price over earnings per share – ModernGraham) was 11.22, which was below the industry average of 18.78, which by some methods of valuation makes it one of the most undervalued stocks in its industry.
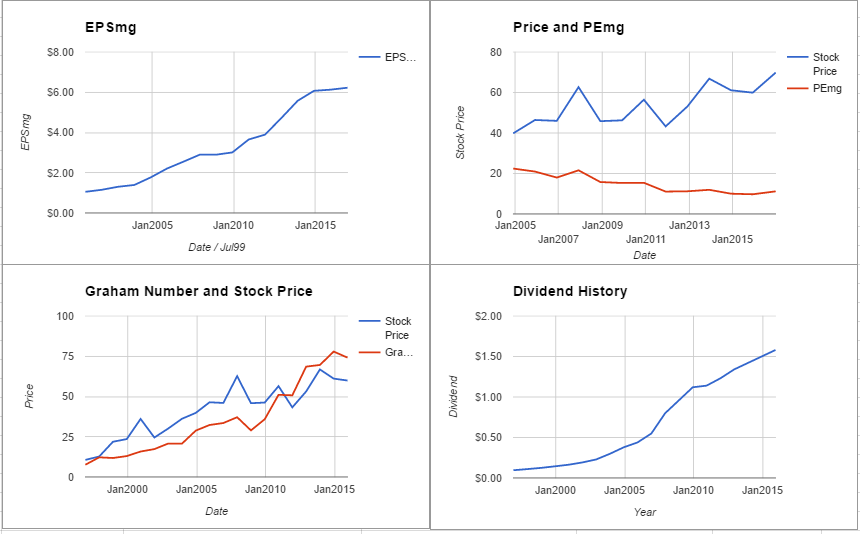
United Technologies Corporation (NYSE:UTX)
United Technologies Corporation qualifies for both the Defensive Investor and the Enterprising Investor. The Defensive Investor is only initially concerned with the low current ratio. The Enterprising Investor has concerns regarding the level of debt relative to the current assets. As a result, all value investors following the ModernGraham approach should feel comfortable proceeding with the analysis.
As for a valuation, the company appears to be Undervalued after growing its EPSmg (normalized earnings) from $5.17 in 2012 to an estimated $7.65 for 2016. This level of demonstrated earnings growth outpaces the market’s implied estimate of 2.29% annual earnings growth over the next 7-10 years. As a result, the ModernGraham valuation model, based on Benjamin Graham’s formula, returns an estimate of intrinsic value above the price.
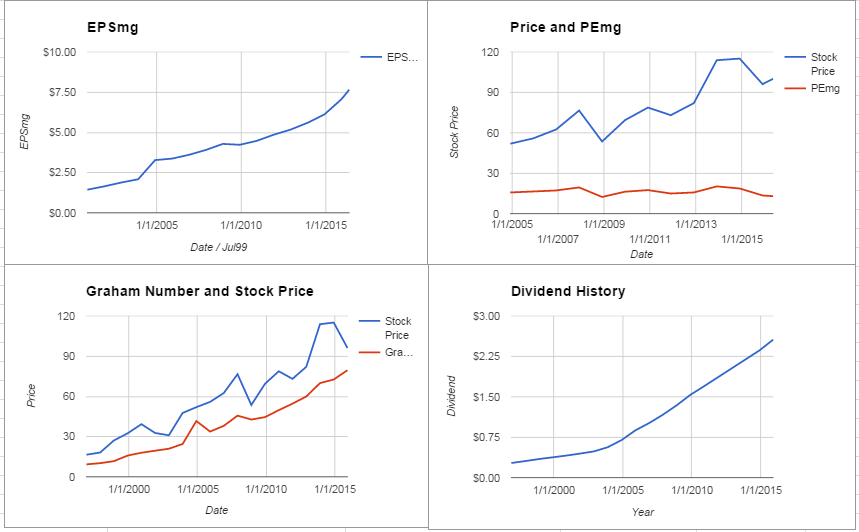
BlackRock Inc (NYSE:BLK)
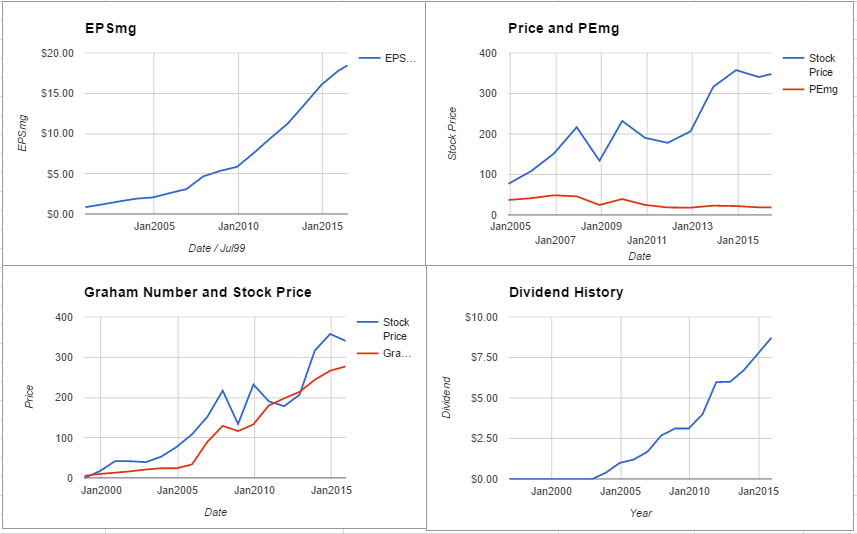
BlackRock, Inc. qualifies for both the Defensive Investor and the Enterprising Investor. In fact, the company meets all of the requirements of both investor types, a rare accomplishment indicative of the company’s strong financial position. . The Enterprising Investor has no initial concerns. As a result, all value investors following the ModernGraham approach should feel comfortable proceeding with the analysis.
As for a valuation, the company appears to be Undervalued after growing its EPSmg (normalized earnings) from $11.21 in 2012 to an estimated $18.46 for 2016. This level of demonstrated earnings growth outpaces the market’s implied estimate of 5.18% annual earnings growth over the next 7-10 years. As a result, the ModernGraham valuation model, based on Benjamin Graham’s formula, returns an estimate of intrinsic value above the price.
Disclaimer:
The author held a long position in Invesco Ltd (IVZ) but did not hold a position in any other company mentioned in this article at the time of publication and had no intention of changing that position within the next 72 hours. See my current holdings here. This article is not investment advice; any reader should speak to a registered investment adviser prior to making any investment decisions. ModernGraham is not affiliated with the company in any manner. Please be sure to review our detailed disclaimer.
