Get 40% Off
⚠ Earnings Alert! Which stocks are poised to surge?
See the stocks on our ProPicks radar. These strategies gained 19.7% year-to-date.
Unlock full list

Could Stock Rally Continue This Week? Here's What To Watch

Published 06/07/2020, 01:28 AM
Updated 09/20/2023, 06:34 AM

Stocks will try to keep their massive rally going this week, but with an FOMC press conference on Wednesday, anything can happen. The most significant risk to the market is an indication that the Fed will pause its QE program or continue to wind down the purchase of Treasuries. The Fed’s balance sheet expansion has seen a noticeable slowdown in recent weeks.

By the way, the correlation between the NASDAQ 100 and the Fed Balance sheet is just 0.687, with an R^2 of 0.47 since QE started in ’09, so not the strongest correlation.

S&P 500 (SPY)

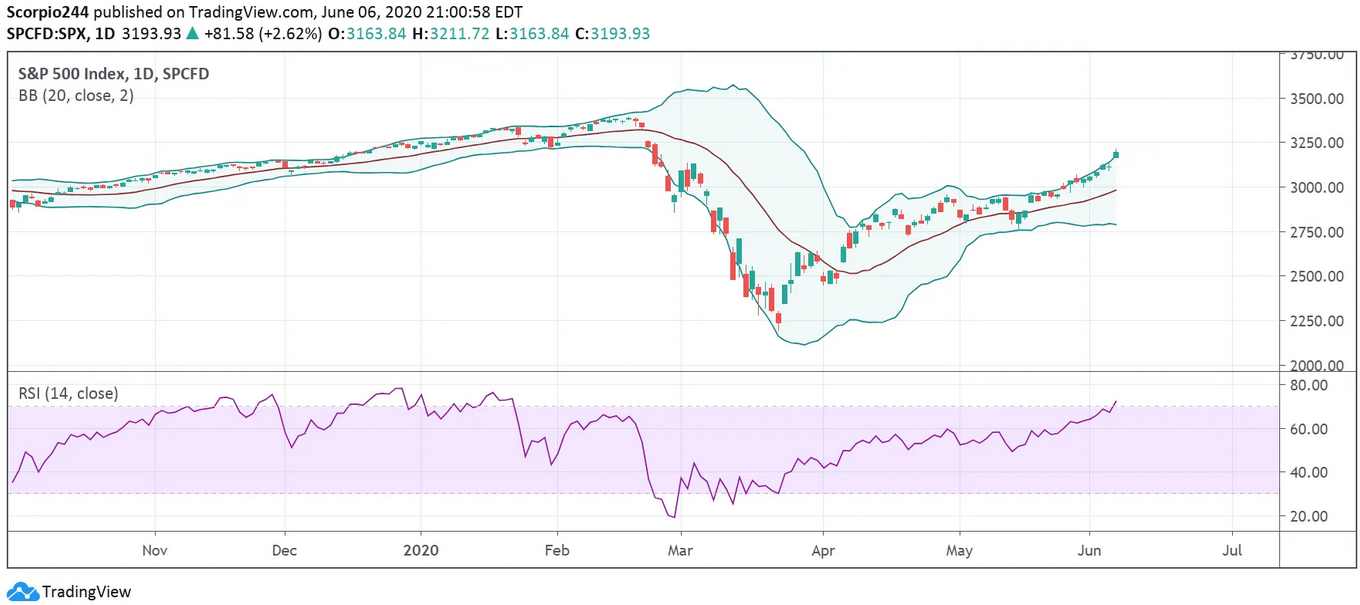
Following Friday’s rally, the S&P 500 is now overbought based on the Bollinger Bands® and the RSI. Still, it doesn’t mean the index can’t continue to run higher to start the week, with the next level of resistance around 3,265.

S&P 500 Index Daily Chart

NASDAQ 100

I took a fresh look at the Q’s because after being so horribly wrong on several occasions, it seems it is worth a shot. The Q’s do have an RSI that is now over 70, and what appears to be a rather large rising wedge pattern. It would suggest a pullback is on the way, perhaps to $224, then $203.
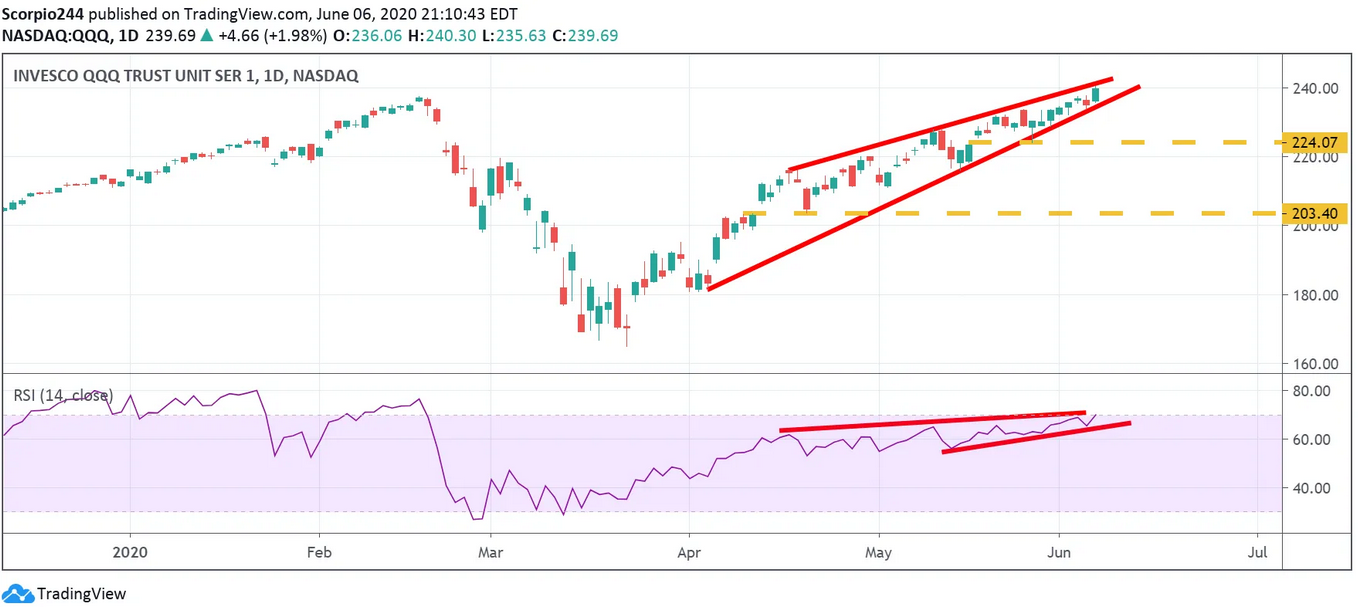
QQQ Daily Chart

QQQ/IWM Ratio

The ratio of the QQQ/IWM suggests to me that the QQQs are due to fall relative to the IWM. Perhaps back to the 1.4 level. It could merely mean that QQQs fall and IWM rises, or the QQQs fall at a faster pace than the IWM.
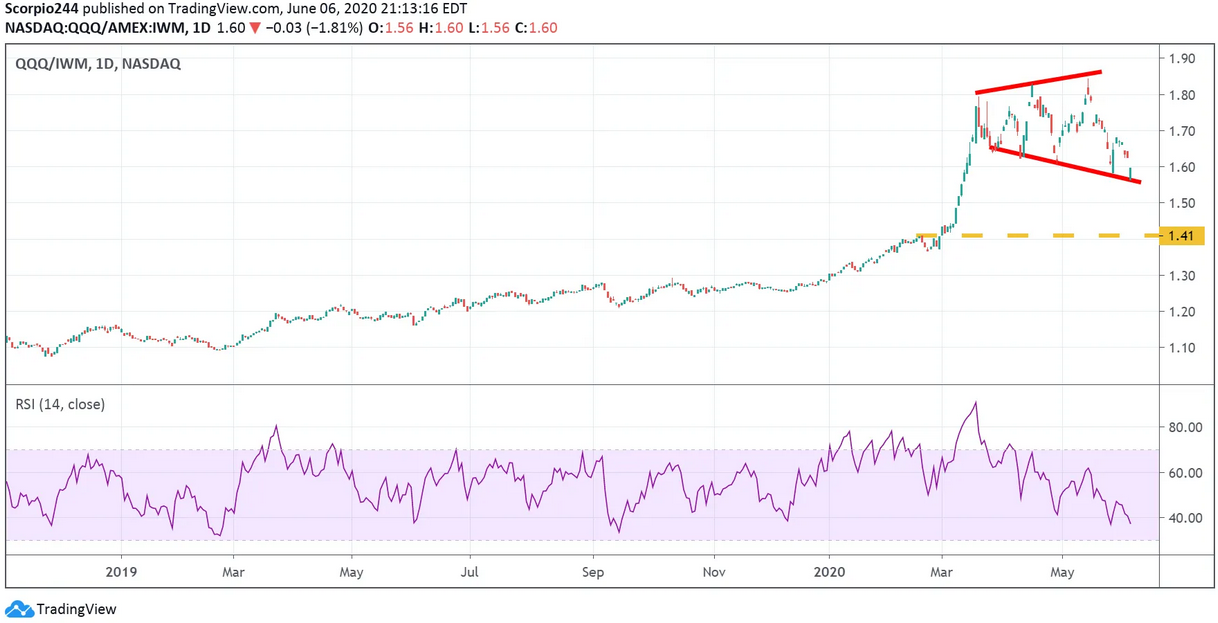
QQQ/IWM Daily Chart

Netflix

There may be a head-and-shoulders pattern forming in Netflix (NASDAQ:NFLX), and a break below $397, likely sets up that drop to $360.
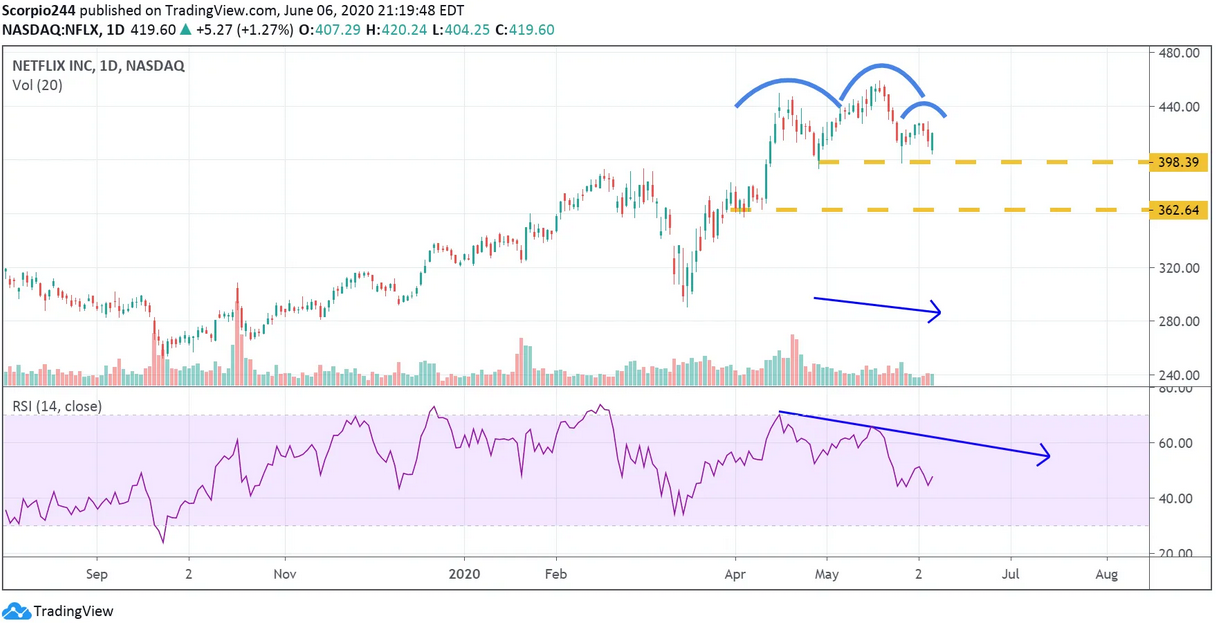
Netflix Inc Daily Chart

Roku

Roku (NASDAQ:ROKU) doesn’t look good again, with an RSI that is trending lower and a stock that is sitting on support. A drop below $102 sets up a fall back $80.
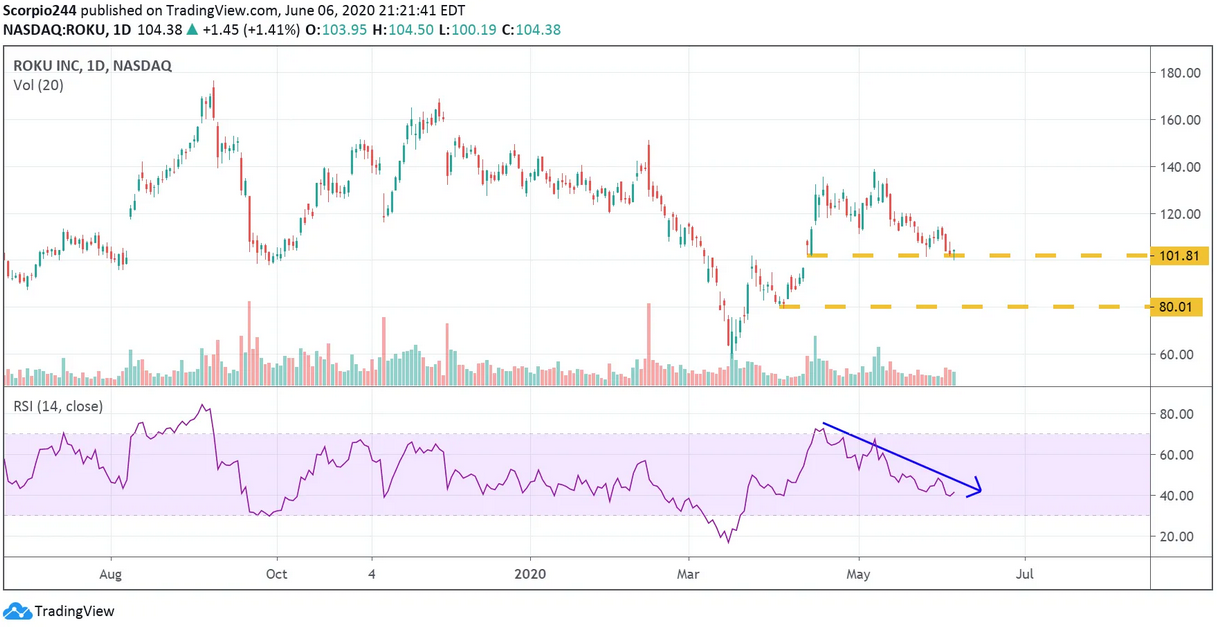
Roku Inc Daily Chart

Facebook

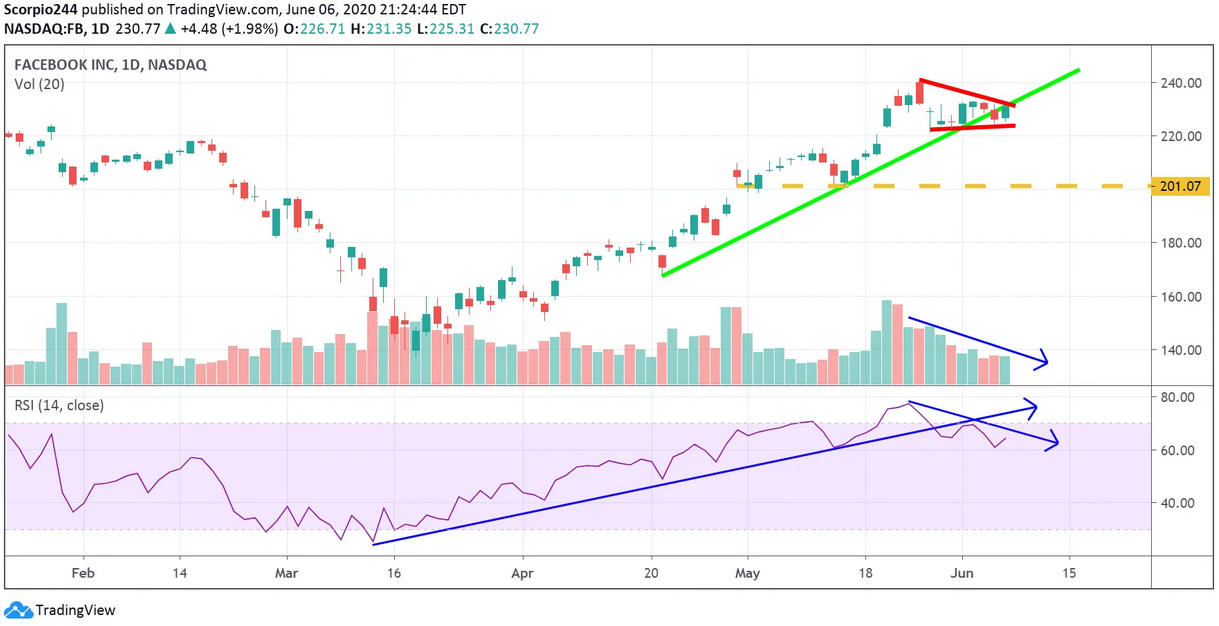
Facebook (NASDAQ:FB) now has a bearish divergence in it, and the stock appears to have formed a descending triangle, with a break of support at $220, the stock probably drops to $201.
Facebook Daily Chart

Twilio

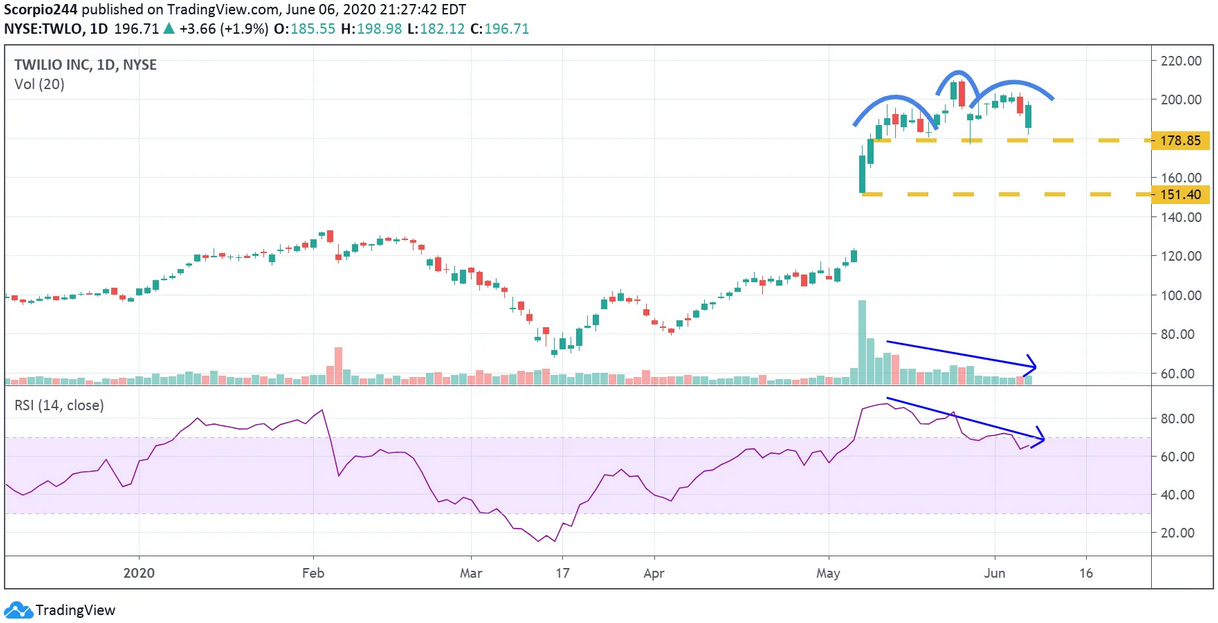
Twilio (NYSE:TWLO) looks like it may have a head-and-shoulders pattern too, and a break of the neckline at $178 sets up a decline to $151.
Twilio Inc Daily Chart

Home Depot

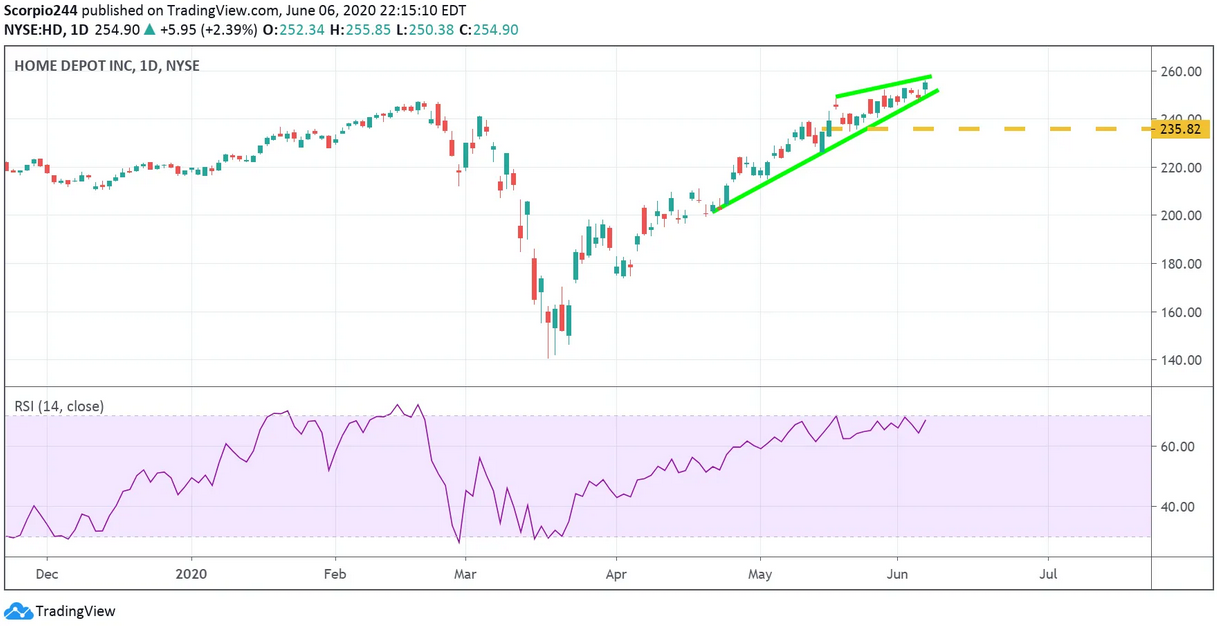
Home Depot (NYSE:HD) also appears to have a rising wedge pattern that has formed. It could result in the shares falling back to $235.
Home Depot Inc Daily Chart

PayPal

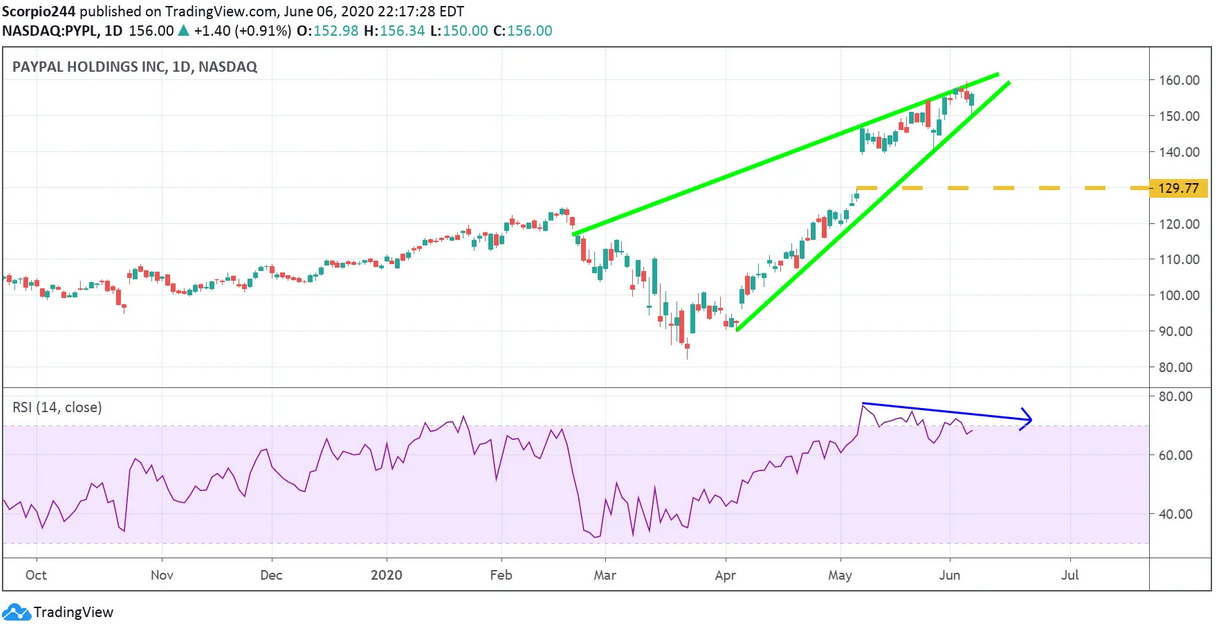
PayPal (NASDAQ:PYPL) continues to lose momentum as the RSI trends lower. If the stock breaks the uptrend, it likely fills the gap back to $130.
PayPal Holdings Daily Chart

Maybe the markets can be kind to me this week and give me a win; it feels like it has been a while.

Original Post

Latest comments

what to buy into?
Roku is Going up today this is in direct opposite direction of your analysis
Are you suggesting a 10% pull back?
Risk Disclosure: Trading in financial instruments and/or cryptocurrencies involves high risks including the risk of losing some, or all, of your investment amount, and may not be suitable for all investors. Prices of cryptocurrencies are extremely volatile and may be affected by external factors such as financial, regulatory or political events. Trading on margin increases the financial risks.
Before deciding to trade in financial instrument or cryptocurrencies you should be fully informed of the risks and costs associated with trading the financial markets, carefully consider your investment objectives, level of experience, and risk appetite, and seek professional advice where needed.
Fusion Media would like to remind you that the data contained in this website is not necessarily real-time nor accurate. The data and prices on the website are not necessarily provided by any market or exchange, but may be provided by market makers, and so prices may not be accurate and may differ from the actual price at any given market, meaning prices are indicative and not appropriate for trading purposes. Fusion Media and any provider of the data contained in this website will not accept liability for any loss or damage as a result of your trading, or your reliance on the information contained within this website.
It is prohibited to use, store, reproduce, display, modify, transmit or distribute the data contained in this website without the explicit prior written permission of Fusion Media and/or the data provider. All intellectual property rights are reserved by the providers and/or the exchange providing the data contained in this website.
Fusion Media may be compensated by the advertisers that appear on the website, based on your interaction with the advertisements or advertisers.
© 2007-2024 - Fusion Media Limited. All Rights Reserved.