Happy New Year! The news flow will really pick up this first week of 2021, with a ton of economic data. This week alone, we will get all the ISM data, ADP Jobs, and Non-Farm Payroll. The data will suggest that the economy slowed in December; just how much it slowed is the concern.
S&P 500
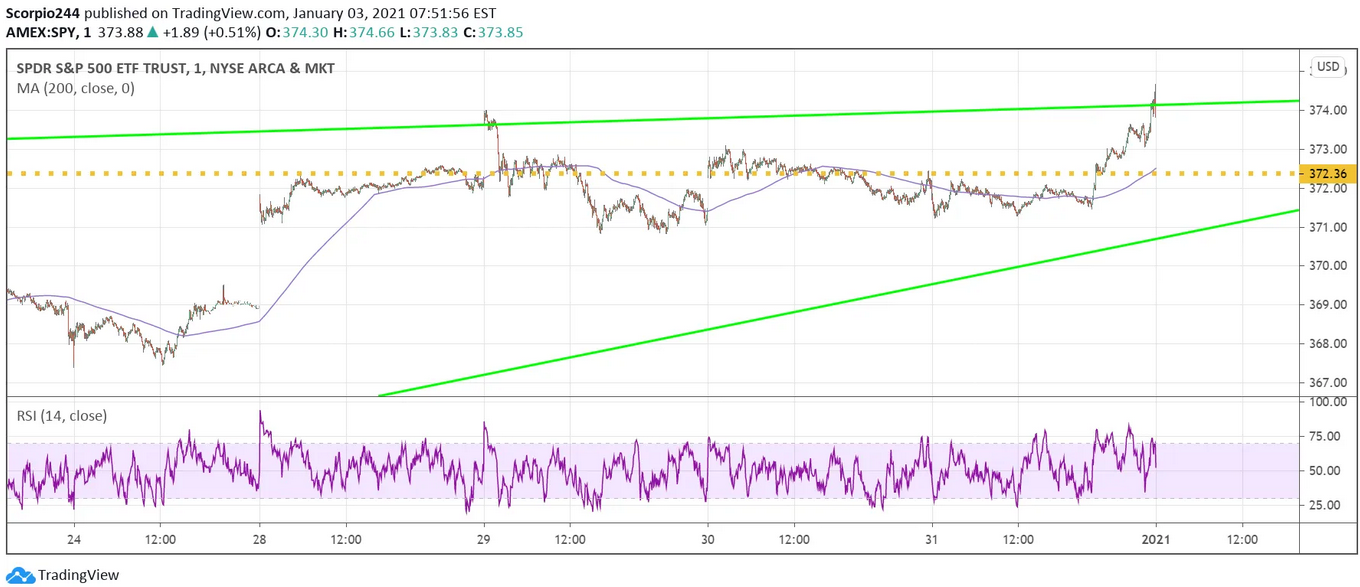
The S&P 500 had no cares throughout much of 2020 about the economy or anything, for that matter. It managed to close at a record on Friday, 3,756. But did the index finally break out? Remember, during the week, I noted that while the S&P futures managed to surge to a new high, it wasn’t until late in the day on Friday that the S&P 500 (NYSE:SPY) hit a new high, confirmed the S&P futures move up.
Notice the big surge higher in the final 10-minutes when it was revealed there was near $6 billion worth of equities to buy on the closing cross, a huge sum. It sent everything surging and pushing the SPY above those previous highs. It leaves me to wonder if the big advance will stick when we come back to work on Monday.
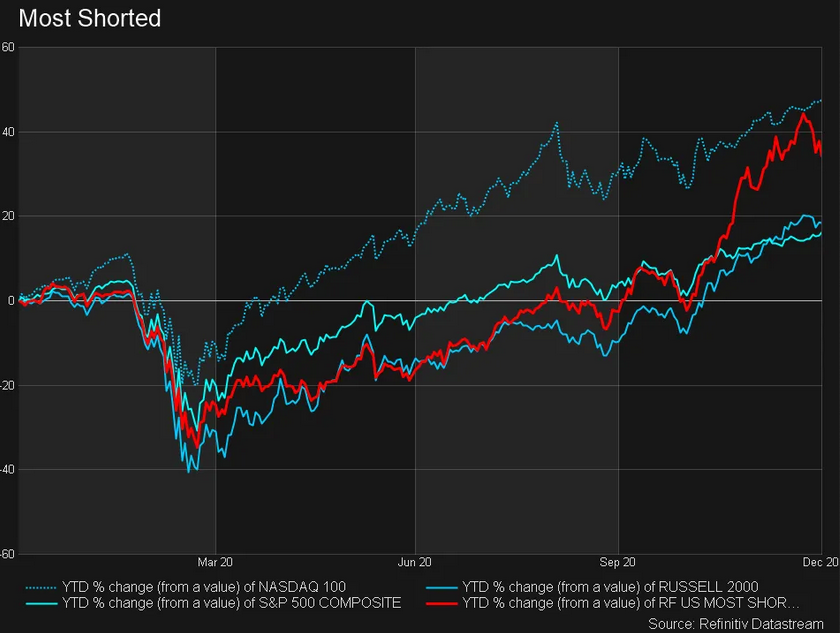
The big question is what the Russell and the most shorted stocks are trying to tell us. As the S&P 500 races higher, the most shorted and Russell have been heading lower and diverging. Is this the start of something, or just a blip? This will be one area of focus this week.
Tesla
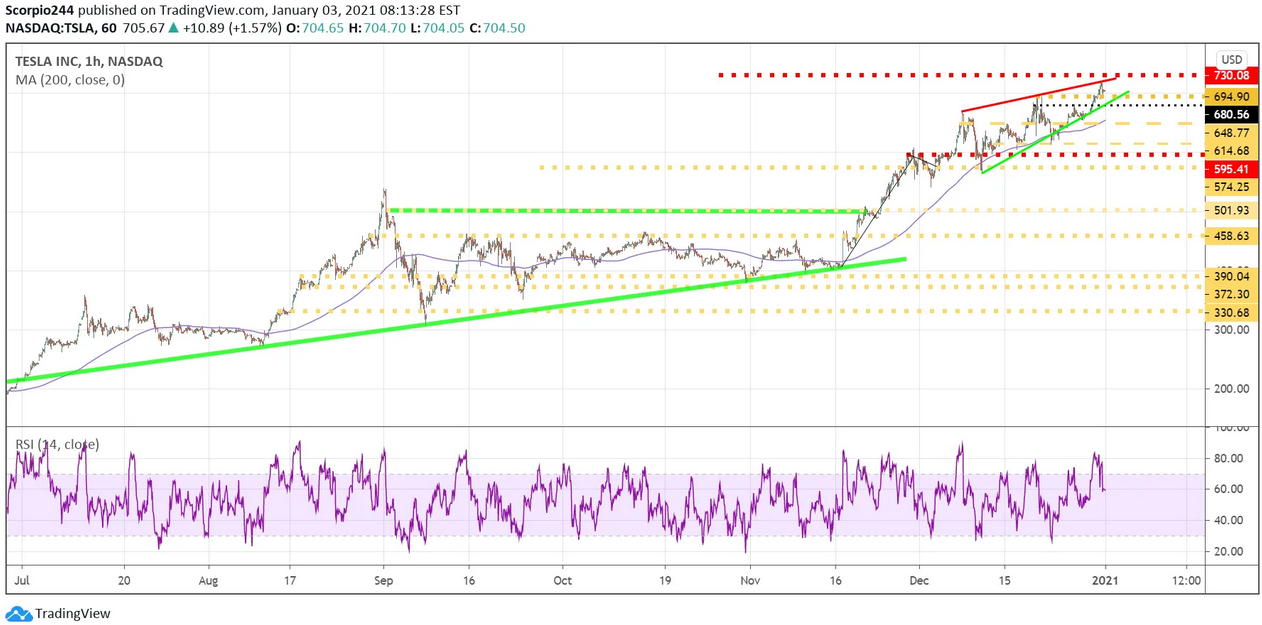
Tesla Inc (NASDAQ:TSLA) released better than estimated fourth quarter delivery numbers, coming in at 499,550. The number was a big beat over what investors were looking for, around 482,000.
The stock managed to break above resistance on Friday at $695, which should now support it. I have been targeting $730 for Tesla since it broke out above $500 in the middle of November. It is pretty close already, but it may get one more boost higher this week before consolidating some.
GameStop
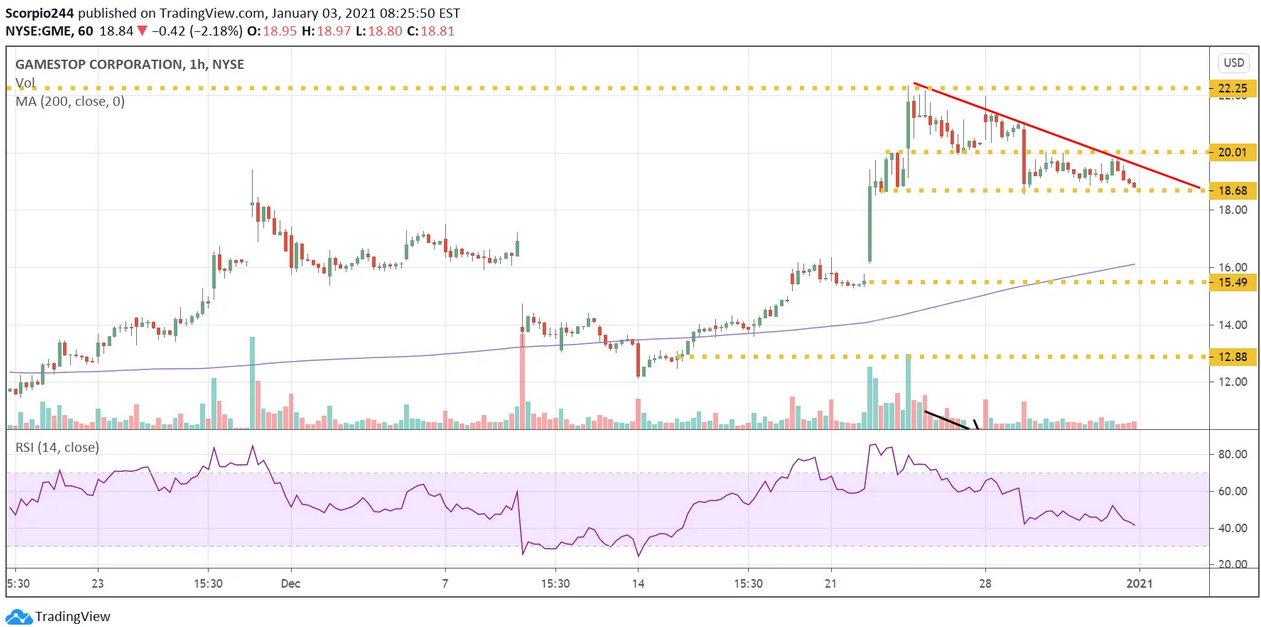
GameStop (NYSE:GME) is down about 16% since I first noted it was in a squeeze higher. I don’t care what happens to this stock over the long-term, but surely the stock was very overextended over the short-term.
Last week I noted the stock would find support around $18.65; it did. Could the stock fall further, sure? Why, you ask? Because the structure of the market says, it can. The implied volatility level for options is around 130%, and the borrow rate is still high at nearly 20%. It means that market makers are holding option pricing for this stock at a high level, and the short-sellers are still very involved.
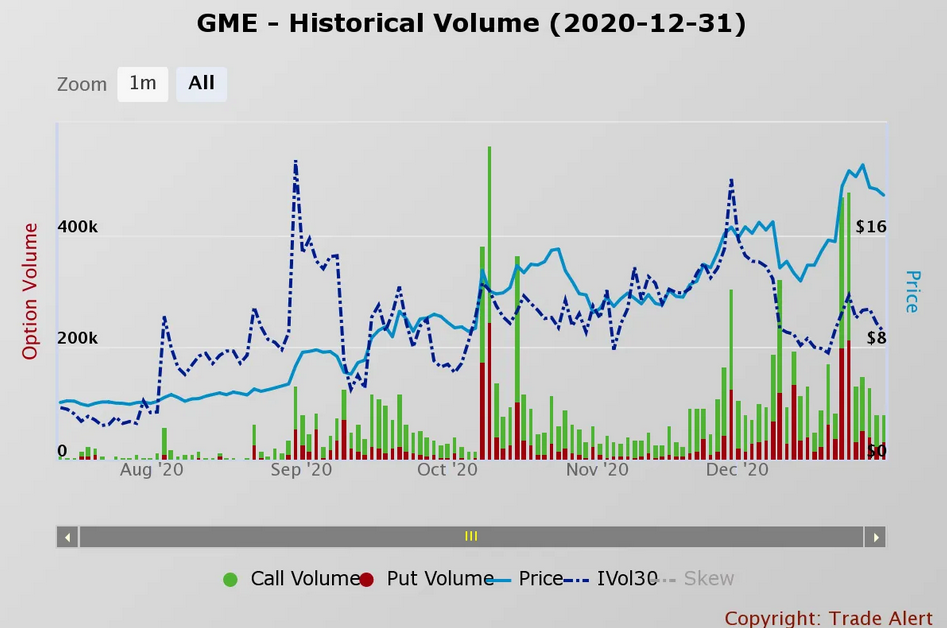
It could result in the stock falling to around $15.50 and filling that technical gap over the NEXT FEW WEEKS, or until something changes.
Fubotv
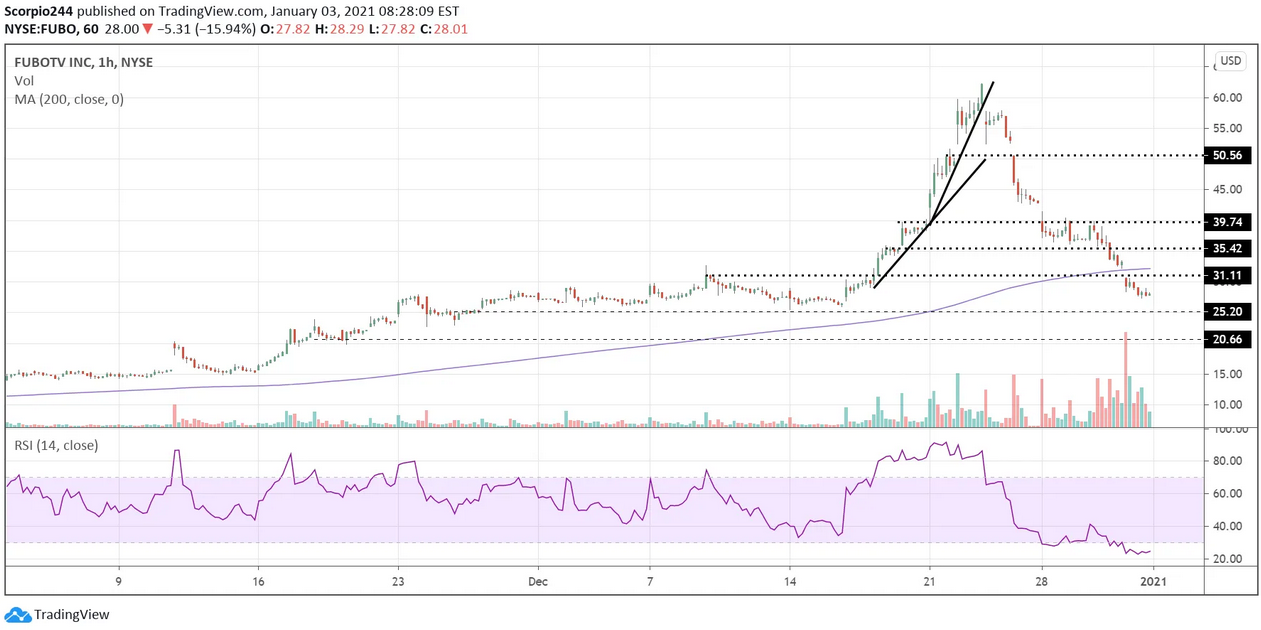
Meanwhile, Fubotv (NYSE:FUBO) was crushed this past week as the lock-up expiration came and went. The squeeze is over, and if the stock can’t stabilize in this $25 “region,” then there is a good chance that $20 is next, maybe even this week.
AT&T
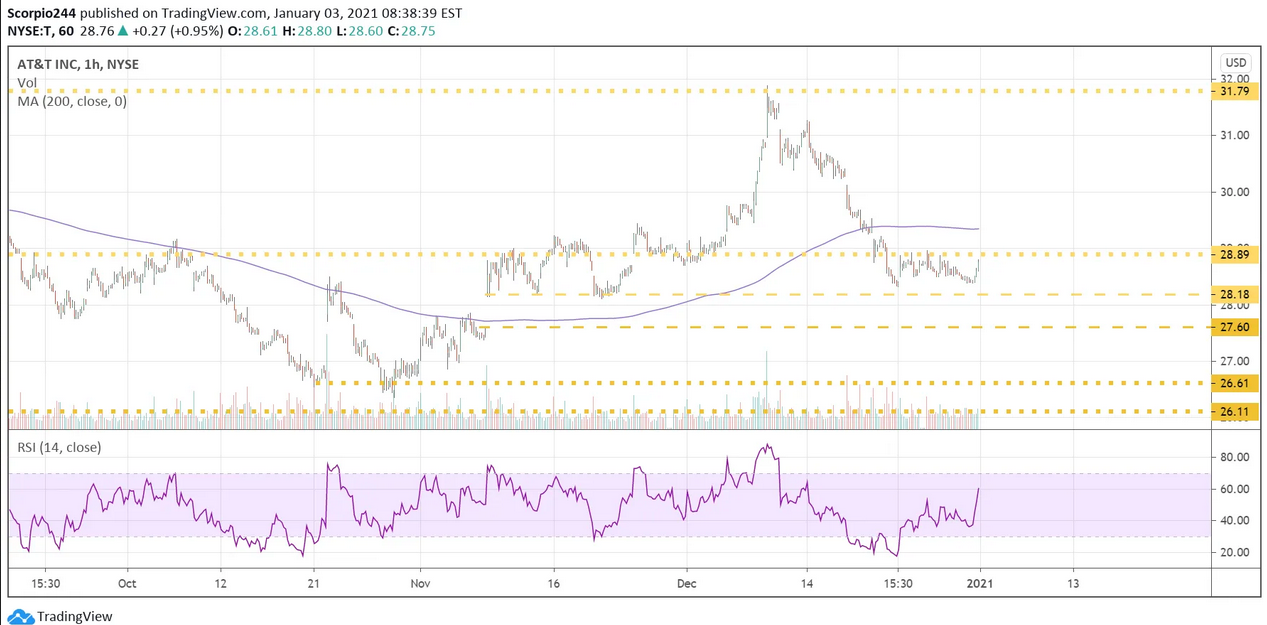
AT&T (NYSE:T) continues to struggle, and the stock doesn’t have many growth drivers to push it higher this year, or next for that matter. Sure HBO Max is growing subscribers, but is it making up for the subscriber losses at DirecTV, how many people are merely switching from the cable bundle to streaming? If HBO Max will impact the business, why are analysts cutting revenue estimates and projecting no growth through 2022? Why does the stock trade at an earnings multiple less than half that of the S&P 500 and below its own historical average? Why does the stock have a 7% dividend yield when the 10-year is at 95 bps, and the spread between the two has never been wider.
A gap fill at $27.60 seems possible over the next 1-3 months.
Apple
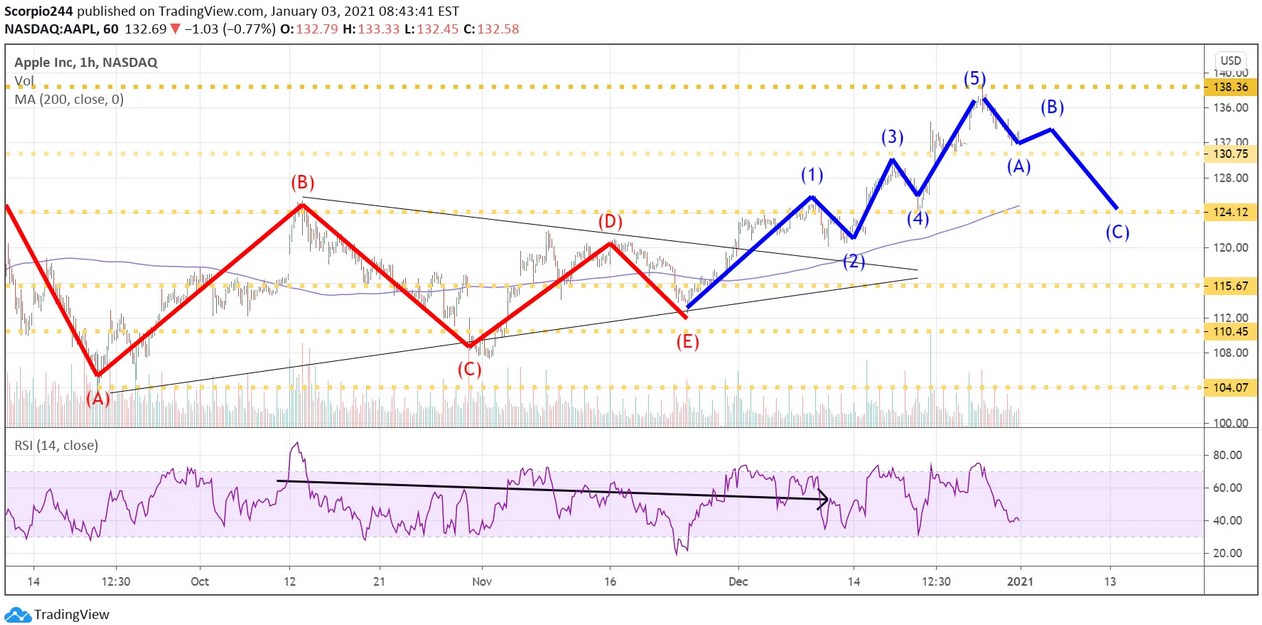
I still think Apple (NASDAQ:AAPL) has a chance to make it back to $124, which I noted last week. The stock made it all the way back to its previous highs around $138 before reversing lower. I still think that is possible towards the end of this week, maybe the beginning of next week.
Amazon
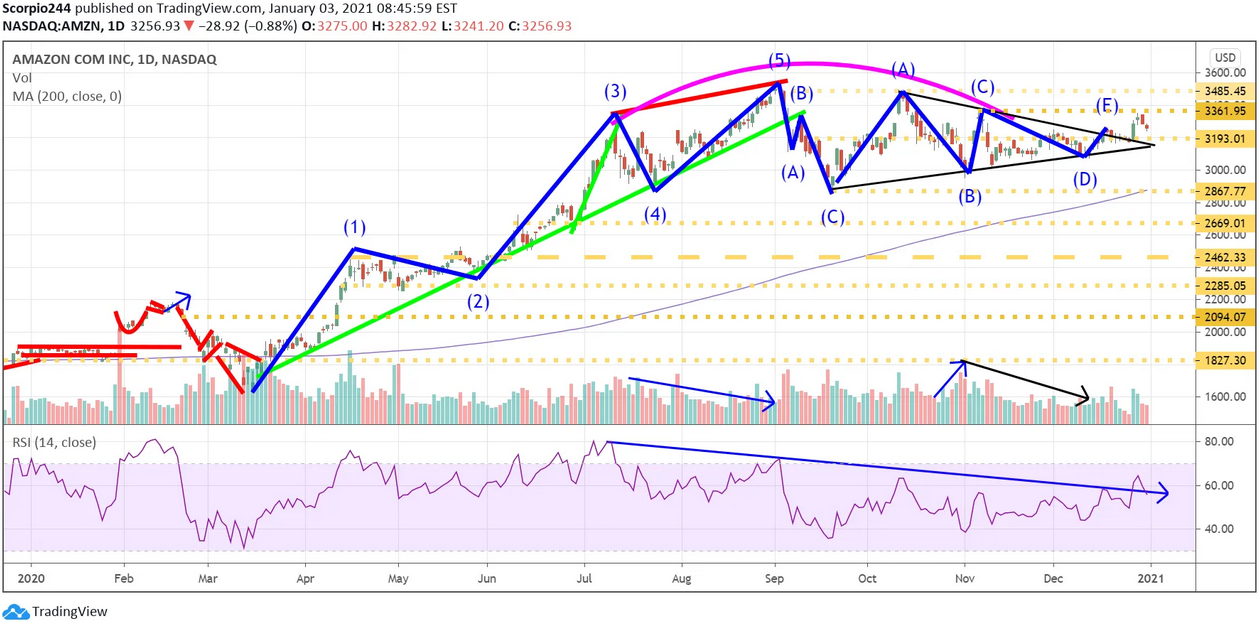
If Amazon.com (NASDAQ:AMZN) moves above $3,360 this week, my call for it to go lower towards $2,870 over the next several weeks is wrong. We will have to see.
Zoom
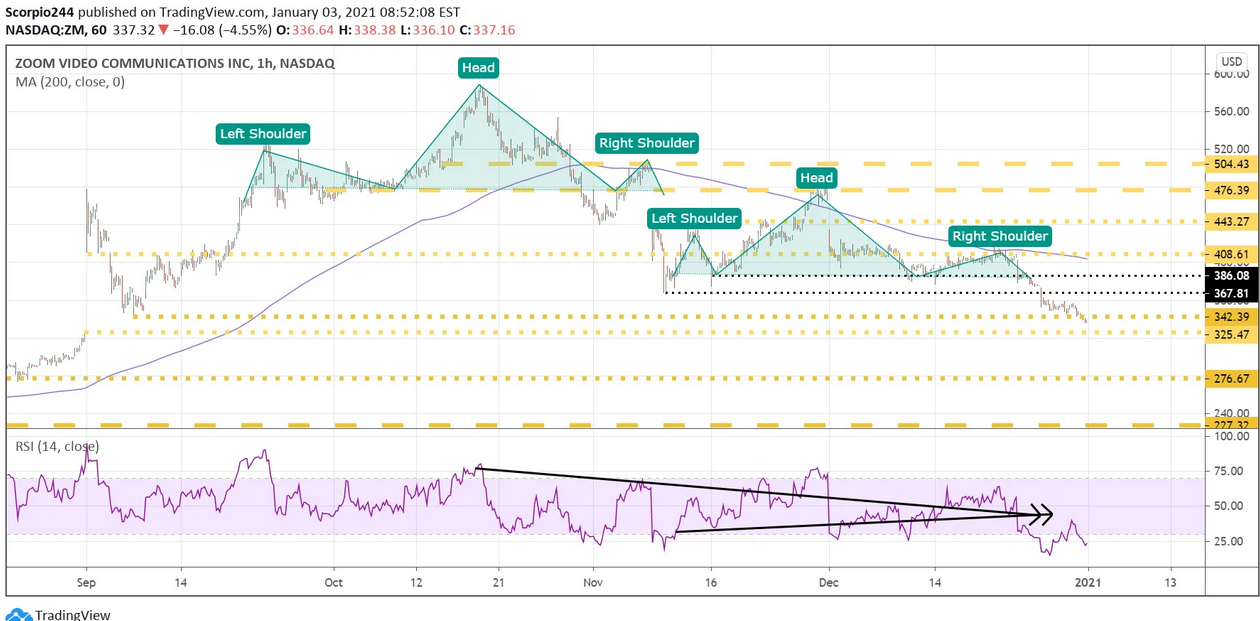
There is still a good chance Zoom Video Communications (NASDAQ:ZM) hits $325 with a gap still left to fill.
Micron
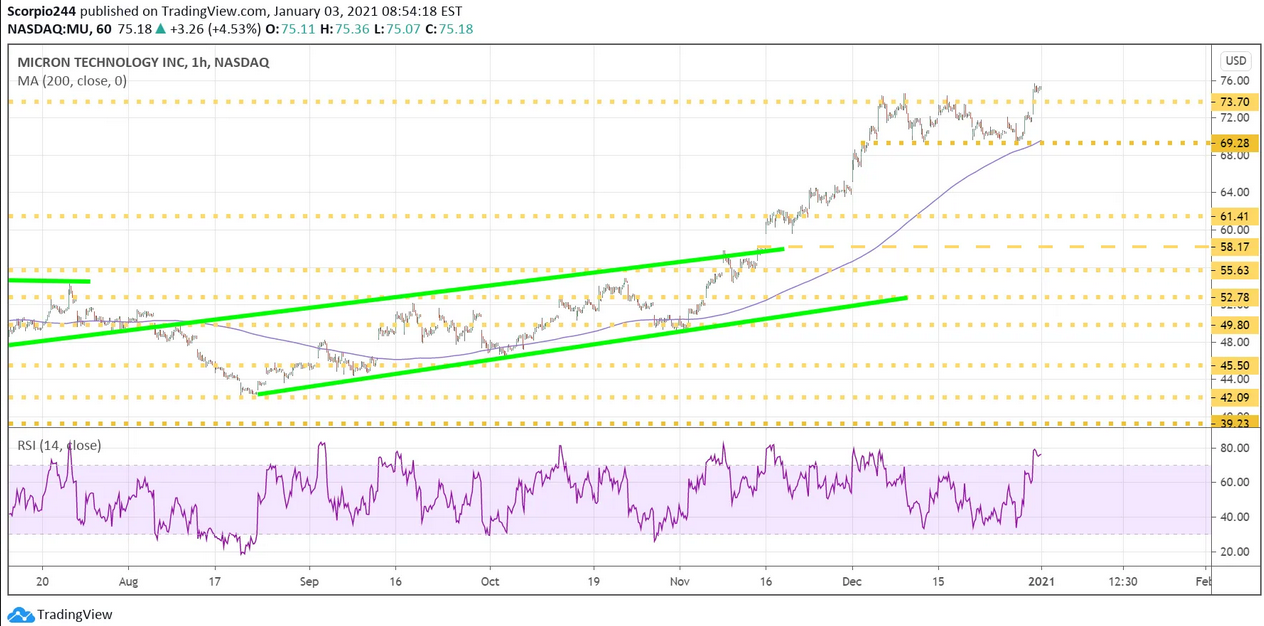
Micron Technology Inc (NASDAQ:MU) moved above resistance at $73 last week, not what I thought would happen, which was that the stock was likely to reverse lower after its big move up. But I’m not perfect. I will have to figure this one out. Be kind to me. It was on Dec. 1 that I first noted $73 was even on the radar.
Have a great first week of 2021!
