


What is Trading Volume?
Trading volume is a fundamental metric in financial markets, representing the total number of shares, contracts, or units exchanged during a specific period. Whether measured in stocks, futures, or cryptocurrencies, it acts as a barometer of market activity, providing critical insights into market sentiment, liquidity, and price movements.
How to Calculate Trading Volume?
The calculation of trading volume does not involve a complex formula, and is straightforward.

Trading Volume = Sum of All Trades in a Time Period
For example, if 1,000 trades occur over a day, and each trade involves 50 shares, the total trading volume for the day would be 50,000 shares.
Why is Trading Volume Important?
Whether investors aim to analyze volume spikes, divergences, or using indicators like OBV or VWAP, mastering trading volume helps them to navigate markets with greater confidence and precision.
Here are a few key features of Trading Volume.
Market Sentiment Indicator
Trading volume reflects the collective interest in a security. Higher volumes often indicate strong investor sentiment, either bullish or bearish, depending on price movement.
Liquidity Measurement
Securities with high trading volumes generally offer better liquidity, enabling investors to buy or sell without significantly impacting the price.
Price Validation
Volume acts as a confirmation tool for price trends. A price movement backed by significant volume is considered more reliable than one with low volume.
How to Interpret Trading Volume?
1. Volume Spikes
A sudden increase in trading volume—known as a “volume spike”—often signals a major price movement. This could result from earnings reports, regulatory changes, or geopolitical events.
2. Divergence
When price trends and volume trends diverge, it may indicate a weakening trend. For instance, rising prices with declining volume might signify an upcoming reversal.
3. Volume as a Momentum Gauge
Sustained increases in volume during an upward price movement signal momentum, while diminishing volume suggests exhaustion.
4. Breakouts and Volume
Breakouts above resistance levels are considered stronger if accompanied by high trading volume. Conversely, weak volume on a breakout may signal a false trend.
Example of Trading Volume Analysis
Let’s illustrate with a hypothetical scenario:
Scenario: Stock XYZ shows an average trading volume of 1 million shares daily. On Day X, volume surges to 3 million shares as the price rises 5%.
Interpretation:
- The surge in volume validates the price increase, signaling strong buying interest.
- Technical analysts may consider this a reliable breakout above resistance, initiating new long positions.
Volume Divergence Example
If XYZ’s price rises 5%, but volume decreases to 500,000 shares, this could indicate weakening momentum, prompting cautious behavior among investors.
Volume Indicators in Technical Analysis
Technical analysts use volume indicators to glean deeper insights:
On-Balance Volume (OBV)
OBV adds or subtracts volume based on price movement, helping investors detect hidden accumulation-distribution of a security.
OBV = Previous OBV + Current Volume (if price rises)
OBV=Previous OBV−Current Volume(if price falls)
Volume-Weighted Average Price (VWAP)
VWAP calculates the average price of a security weighted by volume. Traders use it to identify price fairness during intraday sessions.
VWAP = ∑ (Price × Volume) / ∑ Volume
Chaikin Money Flow (CMF)
CMF examines volume flow over time to determine accumulation or distribution. A positive CMF value suggests buying pressure, while a negative one indicates selling pressure.
The Ultimate Time Saver: Analyze Any Chart in 1 Click 📊⏱️
Manually tracking and cross-referencing MACD, RSI, Volume and Trends alongside daily Candlestick movements is overwhelming and time-consuming.
But what if you could instantly run a full technical health check on any chart and get the institutional-grade verdict in seconds?
Let WarrenAI do the heavy lifting on advanced chart analysis and receive specific entry, stop-loss, and profit target prices based on technical analysis and risk/reward calculations that spot opportunities humans often miss. Stop guessing and start trading with confidence.
Applications of Trading Volume
Stock Market
In the equity market, volume is pivotal for validating breakouts. For instance, a stock surpassing its 52-week high with high volume suggests strong buying interest and the likelihood of sustained upward momentum.
Futures Trading
Volume plays a role in gauging contract liquidity. High volume in futures contracts reduces bid-ask spreads, making them more attractive to traders.
Cryptocurrency Markets
In volatile crypto markets, volume provides insights into the strength of price trends. For instance, Bitcoin’s price rallies are often accompanied by spikes in trading volume across major exchanges.
How to Find Trading Volume?
InvestingPro offers detailed insights into companies’ Trading Volume including sector benchmarks and competitor analysis.
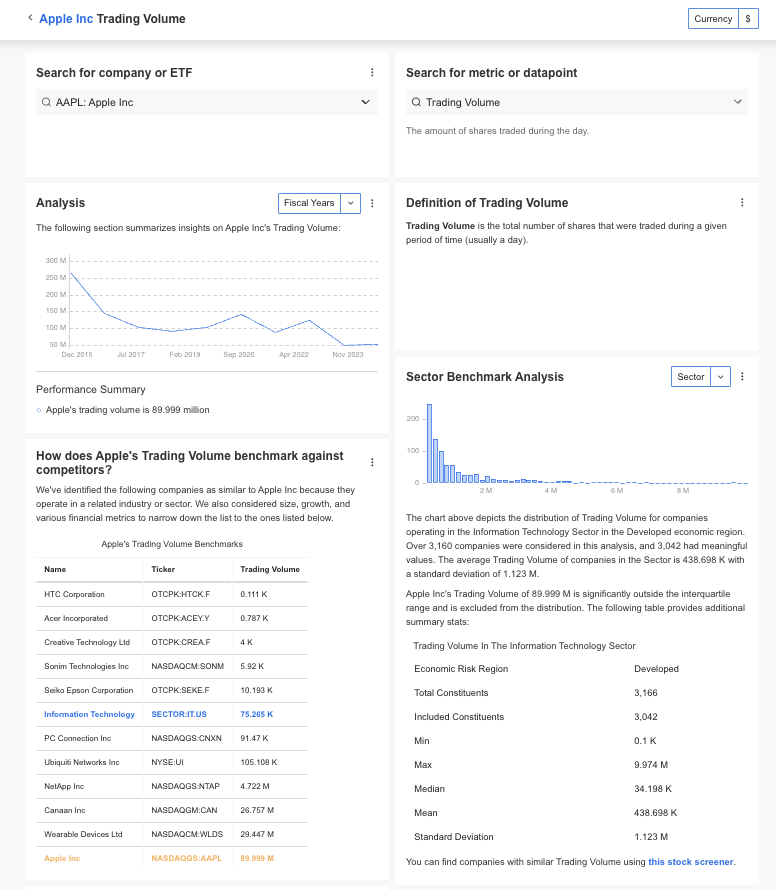
InvestingPro: Access Trading Volume Data Instantly
Unlock Premium Data With InvestingPro 📈💸
Gain instant access to Trading Volume data within the InvestingPro platform
🛠 Access to 1200+ additional fundamental metrics
🔍 Competitor comparison tools
📊 Evaluate stocks with 14+ proven financial models
Trading Volume FAQs
How does trading volume impact liquidity?
Higher trading volumes generally correlate with better liquidity, allowing investors to execute trades more efficiently without significant price impacts.
Is low volume always bad?
Not necessarily. Low volume may indicate consolidation phases, where traders await clearer market signals. However, sustained low volumes in a stock might indicate reduced investor interest.
How do volume spikes relate to volatility?
Volume spikes often coincide with increased volatility due to heightened buying or selling pressure triggered by news, earnings reports, or macroeconomic data.
Can trading volume predict price movements?
Volume doesn’t directly predict prices but confirms the strength of price trends. High volume in the direction of the trend suggests sustained momentum.
Is trading volume relevant in all markets?
Yes, trading volume is a universal metric across equity, bond, futures, and cryptocurrency markets, offering valuable insights tailored to each market’s dynamics.


