


What is Total Liabilities and Equity?
Total Liabilities and Equity represents the sum of a company’s financial obligations (liabilities) and the owners’ claims (equity) on its assets. Understanding total liabilities and equity is essential for evaluating a company’s financial position. By analyzing how a company finances its assets, stakeholders can make informed decisions about investments, growth potential, and risks.
How to Calculate Total Liabilities and Equity?
The formula for total liabilities and equity is straightforward:

Total Liabilities and Equity = Liabilities + Equity
To break it down:
- Liabilities: Sum up current liabilities (due within a year) and non-current liabilities (due after a year). These include obligations like loans, accounts payable, and other debts.
- Equity: Add up components like common stock, additional paid-in capital, retained earnings, and treasury stock (subtracted if applicable). This includes the owners’ investments and retained earnings, representing the net value of the business.

Example Calculation of Total Liabilities and Equity
Consider a company has the following on its balance sheet:
- Current Liabilities: $50,000
- Non-Current Liabilities: $150,000
- Common Stock: $200,000
- Retained Earnings: $100,000
Calculating Total Liabilities
Total Liabilities = Current Liabilities + Non-Current Liabilities
Total Liabilities = 50,000 + 150,000 = 200,000
Now, calculating Total Equity
Total Equity = Common Stock + Retained Earnings
Total Equity = 200,000 + 100,000 = 300,000
Calculating Total Liabilities and Equity
Total Liabilities and Equity = Total Liabilities + Total Equity
Total Liabilities and Equity = 200,000 + 300,000 = 500,000
This total matches the company’s assets, ensuring the balance sheet is balanced.
Why is Total Liabilities and Equity Important?
Total Liabilities and Equity is crucial because it equals the company’s total assets, a fundamental principle in accounting known as the accounting equation:
Assets = Liabilities + Equity
This relationship ensures that every dollar of the company’s assets is accounted for either as a liability (debts owed) or equity (the owners’ residual interest). It provides a clear snapshot of a company’s financial position, helping stakeholders understand how a business finances its operations.
- Financial Snapshot: It provides a quick overview of how a company finances its operations – through debt or equity.
- Investor Confidence: Equity levels indicate the owners’ stake, which helps investors gauge profitability and risk.
- Debt Analysis: High liabilities compared to equity may signal financial risk, while lower liabilities suggest financial stability.
- Compliance: Maintaining balanced books ensures compliance with accounting principles and regulations.
How to Interpret Total Liabilities and Equity?
A “good” total liabilities and equity figure varies by industry and company size. However, the following indicators are helpful:
- Balanced Debt-to-Equity Ratio: A ratio of 1:1 or lower is generally healthy but may differ across industries.
- Asset Growth vs. Liabilities: If assets grow faster than liabilities, the company is likely in good financial health.
- Sustainable Equity Levels: Retained earnings and equity growth indicate profitability and stability.
Investors should analyze this metric in the context of the company’s overall financial strategy and industry benchmarks.
Limitations of Total Liabilities and Equity
Understanding this metric ultimately aids in assessing a company’s financial position. However, it has a few limitations, which investors should be aware of, which include:
- Static Representation: It reflects the financial position at a specific point in time and may not capture ongoing changes.
- Subjective Valuations: Asset and equity values depend on accounting estimates like depreciation or market conditions, which may not reflect true economic value.
- Ignores Cash Flow: It doesn’t provide insights into cash flow, a critical indicator of operational health.
- Debt-Equity Mix: A high liabilities figure may raise alarms, but in some cases, leveraging debt strategically can be beneficial for growth.
How to Find Total Liabilities and Equity?
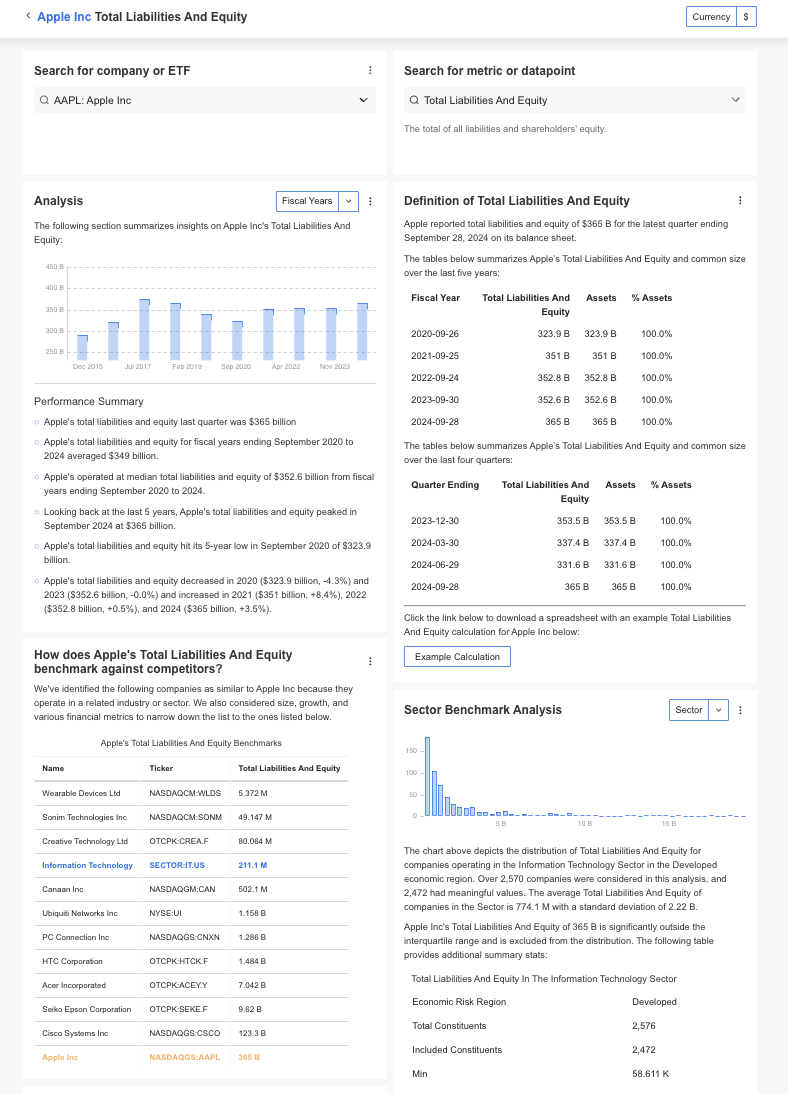
InvestingPro offers detailed insights into companies’ Total Liabilities and Equity including sector benchmarks and competitor analysis.
InvestingPro: Access Total Liabilities and Equity Data Instantly
Unlock Premium Data With InvestingPro 📈💸
Gain instant access to Total Liabilities and Equity data within the InvestingPro platform
🛠 Access to 1200+ additional fundamental metrics
🔍 Competitor comparison tools
📊 Evaluate stocks with 14+ proven financial models
Total Liabilities and Equity FAQ
Why does total liabilities and equity equal total assets?
This is due to the accounting equation: assets are financed either through liabilities or equity, ensuring the balance sheet balances.
Can total liabilities exceed total equity?
Yes, this happens when a company finances more through debt than equity. While common in capital-intensive industries, excessive liabilities can signal financial risk.
Does total liabilities and equity include cash?
No, cash is part of assets. Total liabilities and equity represent how those assets are financed.
How often do companies calculate total liabilities and equity?
It’s calculated at least annually for financial reporting but can also be tracked quarterly or monthly for internal analysis.
How can I use this metric as an investor?
Compare total liabilities and equity with total assets and other financial ratios (like debt-to-equity) to assess financial health and risk levels.


