By Noel Randewich
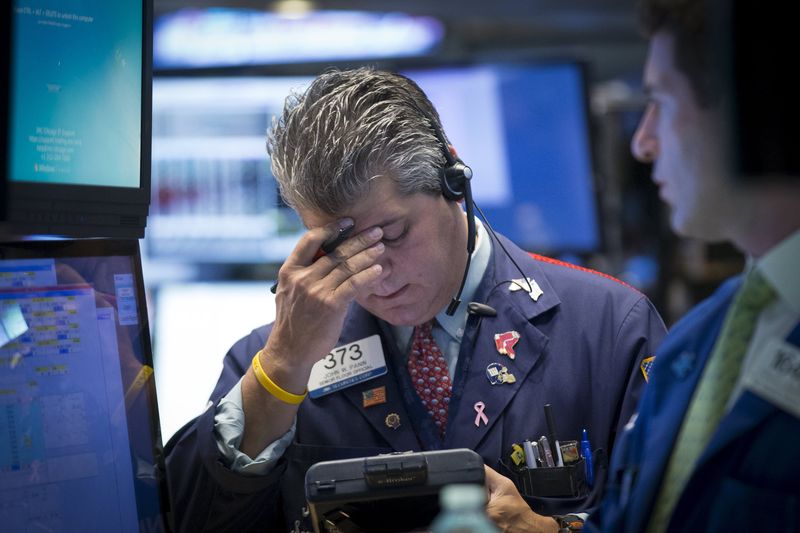
(Reuters) - U.S. stock indexes plunged almost 4 percent on Monday as investors, rattled about China's economy, sold heavily in an unusually volatile session that confirmed the benchmark S&P 500 was formally in a correction.
The Dow Jones industrial average (DJI) briefly slumped more than 1,000 points - its most dramatic intraday trading range ever - with key component Apple (O:AAPL) falling heavily only to claw back but end down 2.5 percent.
It was the S&P 500's worst day since 2011 and followed an 8.5 percent slump in China markets (SSEC), which sparked a sell-off in global stocks along with oil and other commodities.
Wall Street had stayed in a narrow range for much of 2015, but volatility returned this month as investors became increasingly concerned about a potential stumble in China's economy and after Beijing surprisingly devalued its yuan currency
Some investors unloaded stocks ahead of the close after looking to make money from volatile price swings earlier in the session.
"If things don't settle down in China, we could have another ugly open (Tuesday) and you wouldn't want to be caught holding positions you bought this morning," said Randy Frederick, managing director of trading and derivatives for Charles Schwab (NYSE:SCHW) in Austin.
In comments to CNBC, Apple Chief Executive Tim Cook took the unusual step of reassuring shareholders about the iPhone maker's business in China ahead of a dramatic 13-percent drop in its share price then rebound to close at $103.12, down 2.5 percent.
The Dow Jones industrial average (DJI) closed down 588.4 points, or 3.57 percent, at 15,871.35.
The S&P 500 (SPX) lost 77.68 points, or 3.94 percent, to 1,893.21, putting it formally in correction mode.
The Nasdaq Composite (IXIC) dropped 179.79 points, or 3.82 percent, to 4,526.25, also in a correction.
An index is considered to be in correction when it closes 10 percent below its 52-week high. The Dow was confirmed to be in a correction on Friday.
Futures for Hong Kong's Hang Seng index
In a sign the U.S. market may begin to see some stabilization on Tuesday, U.S. stock futures opened for the overnight session to the upside. S&P 500 e-minis
The CBOE Volatility index (VIX), or VIX - popularly known as the "fear index" - briefly jumped as much as 90 percent to 53.29, its highest since January 2009.
Preliminary data from BATS Global Markets show 1,287 trading halts on U.S. stock exchanges on Monday due to excessive volatility or tripping of circuit breakers, far more than usual.
The S&P 500 index posted 187 new 52-week lows and just two highs, while the Nasdaq recorded 613 new lows and eight highs.
"Emotions got the best of investors," said Philip Blancato, chief executive at Ladenberg Thalmann Asset Management in New York. "The conjecture that the Chinese economy can propel the U.S. economy into recession is ridiculous, when it's twice the size of the Chinese economy and is consumer-based."
All of the 10 major S&P 500 sectors ended lower, with energy <.SPNY> losing 5.18 percent.
U.S. oil prices
Exxon (N:XOM) and Chevron (N:CVX) each fell more than 4.7 percent. U.S. oil and gas companies have already lost about $310 billion of market value so far this year.
The dollar index (DXY) was down 1.72 percent. It fell more than 2 percent earlier to a seven-month low as the perceived probability of a U.S. interest rate hike in September receded.
Traders now see a 24 percent chance that the Federal Reserve will increase rates in September, down from 30 percent late on Friday and 46 percent a week earlier, according to data from inter-dealer money broker Tullett Prebon.
Wall Street's selloff shows investors are becoming increasingly nervous about paying high prices for stocks at a time of minimal earnings growth, tumbling energy prices and uncertainty around a Fed rate hike.
Alibaba (N:BABA) lost 3.49 percent to $65.80, below its IPO price of $68, making it the second high-profile tech company to fall below its IPO price in the past week after Twitter (N:TWTR).
Declining issues outnumbered advancers on the NYSE 3,064 to 131. On the Nasdaq, 2,632 issues fell and 281 advanced.
Volume was heavy, with about 14.0 billion shares traded on U.S. exchanges, double the 7.0 billion average this month, according to BATS Global Markets.
